
Progress has been defined by reductions in daily rates that tend to fluctuate widely among locations. Rates that have accumulated during the pandemic are more stable, having subsumed these fluctuations, and provide evidence as to where we have been. Here we focus on cumulative COVID-19 outcomes and examine differences among 95 of the nation’s largest counties. This larger dataset allows more precise statistical evaluation of potential predictors.
We examined contrasts between the selected urban counties in each state and the remainder, which we designated as “rural”. The underlying assumption is that, while urban areas may differ within a state, rural areas may tend to be more uniform. We considered urban counties in 32 of the contiguous states and the District of Columbia, based on data up to April 22, 2022. Our previous analysis of these jurisdictions was based on data up to May 16, 2021 [1]. Mean values are shown in the table.
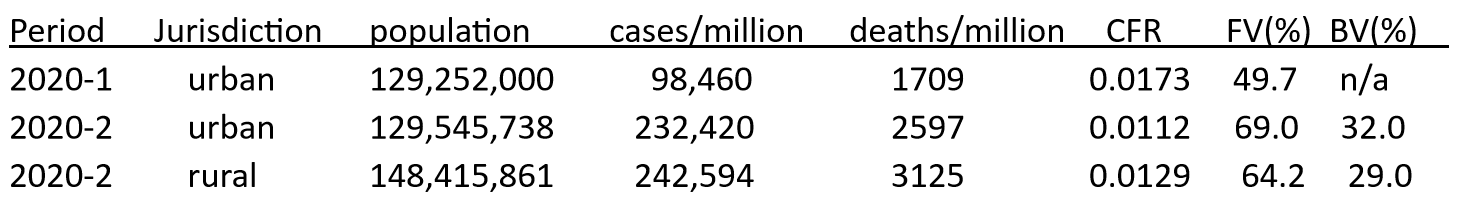
These rates correspond to about 80 million cases and 900,000 deaths for the nation, averaging about 100,000 new cases and 1,200 deaths per day. For comparison, daily rates were down to 56,000 cases and 320 deaths on May 1, showing much more recent improvement in deaths than in infection rates.
The COVID variables of interest are cases (infections), cumulative deaths, case-fatality rates (CFRs), fully vaccinated percentages (FV, with 2 shots), and boosted percentages of the total population (BV, with 3 shots). Using cross-sectional regression analysis, we considered (spatial) relationships with selected demographic variables including age, race, income, political preference, and measures of ambient air quality. We performed no trend analyses, but our previous analysis showed modest urban-rural gradients varying over time. [1]
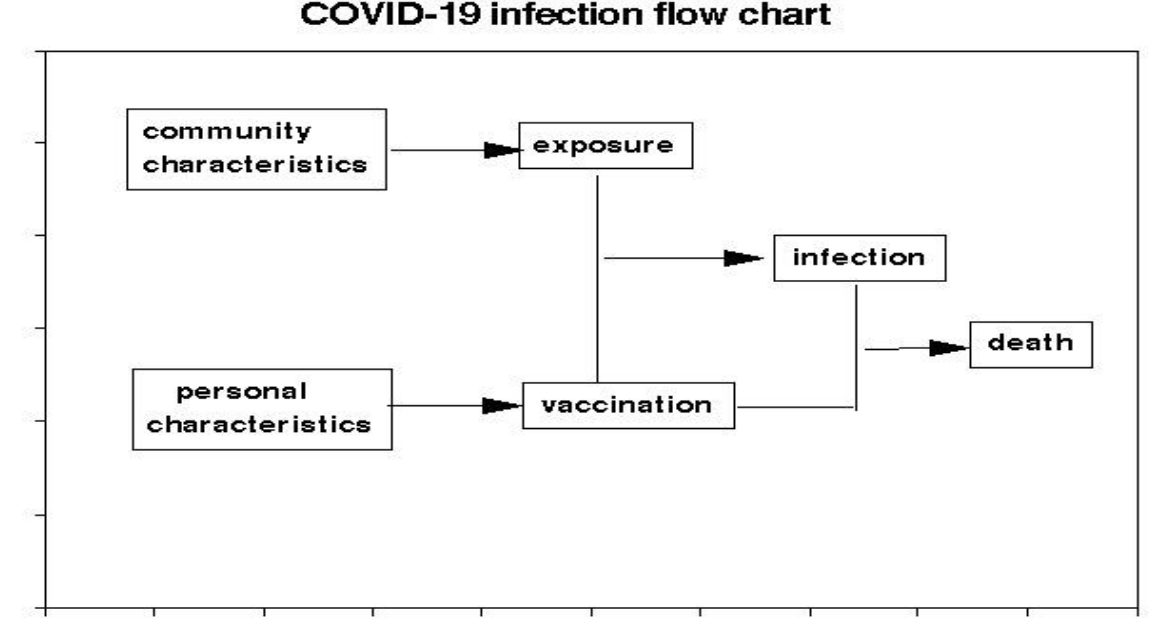
The flow chart depicts our population-based conceptual model of the pandemic. Infection is a necessary precursor of death (by a small percentage, thankfully) and is controlled by the tradeoff between exposure to the virus and protection by vaccination, which can also reduce mortality by reducing the severity of infection. Exposure can be affected by population density, household occupancy, social distancing that may also be affected by occupation and economic conditions, and ambient air pollution that can enhance virus transmission. The decision to vaccinate is personal and is affected by age, race, and distrust of science and public health authorities, for which we use political persuasion in the 2020 Presidential election as an indicator. Needless to say, there are interactions between community and personal characteristics, and we recognize that COVID outcomes are likely to be multifactorial. Like most things in life, responsibility cannot be assigned to a single agent.
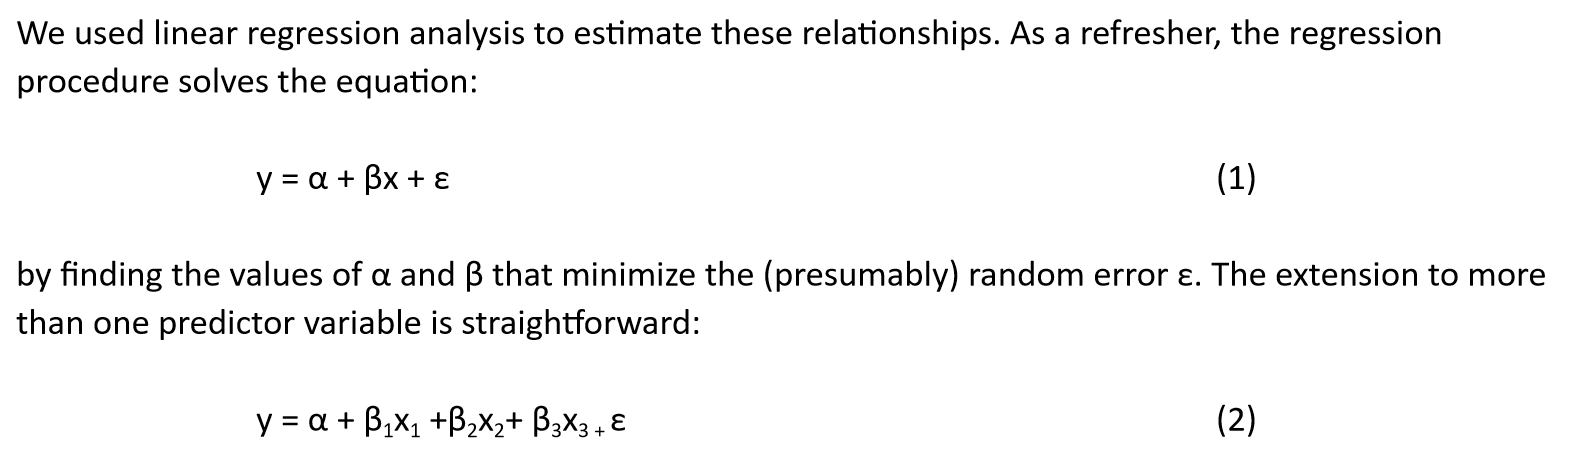
The measure of success of this procedure is the correlation coefficient R, which reflects the relative magnitude of the error term ε; larger values of R indicate stronger relationships. For this sample of 95 counties, R values > 0.18 would be considered statistically significant. In a univariate model (1), a negative value of β and hence R indicates a contrary relationship: an increased x would reduce y, and vice versa. In a multifactorial relationship, increasing the number of x terms should reduce the error term ε.
We first tested differences in COVID outcomes between urban and rural portions of states and found that vaccination status was the main factor rather than residential location, per se. Next, we used regression analyses across the 95 urban counties to identify statistically significant predictor variables for cases, deaths, and vaccination rates. Those variables fell into three groups:
-
Vaccination status: the original 2-shot program (FV) and the boosted portion comprising 3 shots (BV).
-
Individual characteristics: age, race, ethnicity, political affiliation.
-
Community characteristics: population density, persons per household, median household income, poverty status, ambient air quality.
We evaluated these potential predictors individually and then combined the significant ones using multivariate regressions.
-
Cases were predicted by the percentages of booster vaccination (-), Hispanic population (+), and Republican voters (+), with an overall correlation coefficient of 0.79.
-
Deaths were predicted by the percentages of booster vaccination (-), Hispanic population (+), and persons aged 65 and over (+), with an overall correlation coefficient of 0.71.
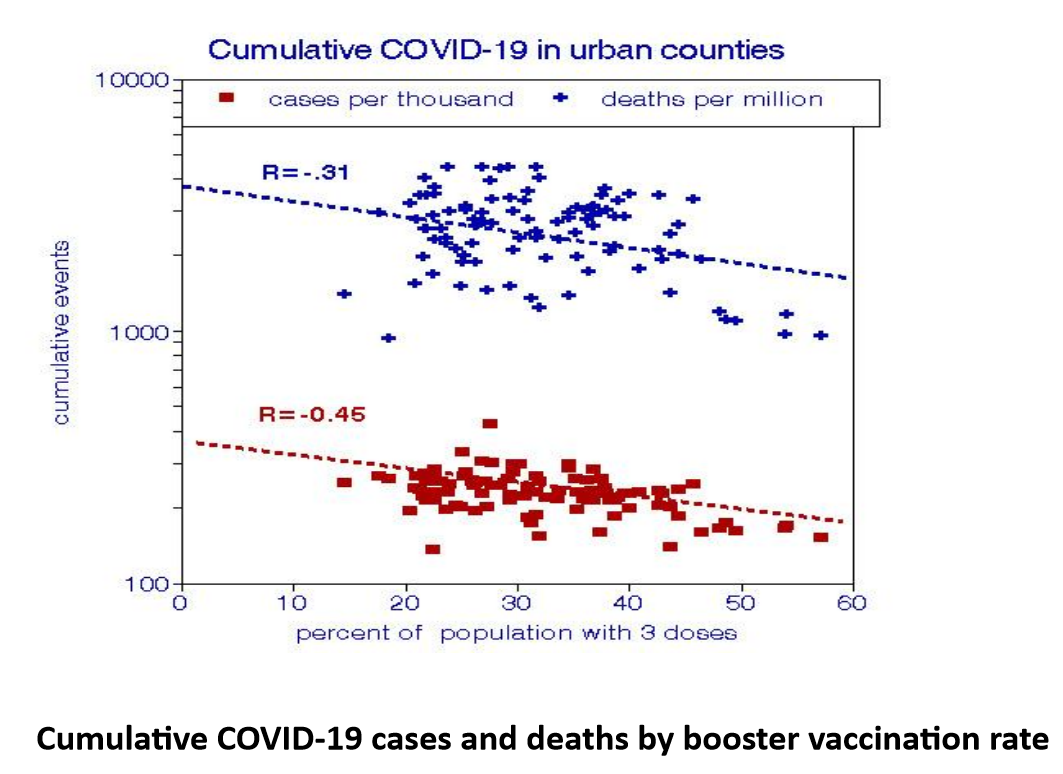
Relationships with FV and BV were similar with a slight advantage for BV, as shown in the graphs. Accordingly, we examined relationships between BV rates and each of the other ostensibly independent variables one at a time, using the correlation coefficient (R) to indicate relative importance.
These data indicate that persons in economically advantaged cities were more likely to have obtained booster shots. Those in more racially diverse cities were less likely, and voting Republican was the strongest indicator of vaccine recalcitrance. Relationships with ambient air quality were mixed. The weak relationship with age is somewhat surprising and may have resulted from interactions with other factors. All of these variables are intercorrelated. For example, booster vaccination rates are significantly associated with voting Democratic, being non-Hispanic, aged 65 and older, with a correlation coefficient of 0.53.
We used the multivariate regression equation relationship (2) to predict percentage booster vaccination rates for the following classifications of individuals:
-
All non-Hispanic Democrats aged 65+ would have been boosted.
-
43% of non-Hispanic Democrats aged <65 would have been boosted.
-
17% of Hispanic Democrats aged 65+ would have been boosted.
-
73% of non-Hispanic Republicans aged 65+would have been boosted.
-
11% of non-Hispanic Republicans aged <65 would have been boosted.
-
No Hispanic Republicans aged 65+ would have been boosted.
These options span the entire gamut of booster vaccination rates. Among these factors, Hispanic ethnicity had the strongest negative association with booster vaccination status, which would translate to higher rates of infections and deaths. Our regression results, shown by the graphs, predict:
-
Complete booster vaccinations resulted in 25% fewer cases and 50% fewer deaths.
-
Hispanic populations had 65% more cases and 140% more deaths.
-
The elderly (age 65+) had a 90-fold increase in deaths.
-
Republican voters had 40% more cases.
The multivariate analysis predicts substantially smaller vaccination benefits than those shown on the single-variate graphs because decisions to vaccinate tend to be correlated with other variables, notably the percentage of Hispanic ethnicity in the county. This finding is supported by CDC data on individuals that indicate about 70% more COVID-19 deaths for Hispanics than for whites. The political relationship is supported by studies showing higher rates in Republican counties for all causes of death.

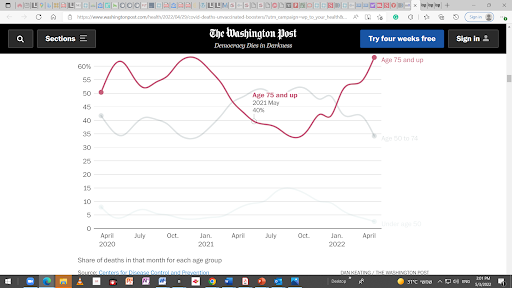
Cumulative COVID-19 cases and deaths by full vaccination rate
The graphs show that the booster vaccination rate was a better predictor of case and death rates than the original vaccination program, suggesting waning vaccine efficacy. However, the multivariate regression analysis shows that vaccination rate was only one of several factors associated with variations in COVID-19 outcomes among the 95 urban counties.
Overall, we conclude:
-
When vaccination rates were taken into account, there were no significant differences in COVID-19 rates between the urban and rural portions of 32 states.
-
Counties with larger fractions of Hispanic residents tended to have lower vaccination rates and higher COVID rates. This finding warrants further investigation.
-
Personal characteristics were better predictors of booster vaccination than community characteristics and were more important for COVID-19 outcomes.
How you lived during the pandemic was more important than where you lived, and vaccination status was the key.
[1] Variations in COVID-19 Rates Among 100 Large U.S. Counties, ACHS June 25, 2021


