
We aim to examine these pandemic trends holistically, recognizing that events on successive dates may not be entirely independent. For example, high infection rates may be succeeded by lower rates because of enhanced “herd” immunity, and vaccination efficacy has been shown to wane a few months after injection. The winter peaks in cases and deaths resemble the seasonality typically seen with influenza.
Sources of Variation.We classified relationships governing COVID-19 outcomes as spatially dependent (S) and to their temporal extent - short-term, e.g., weekly (ST), or long-term, e.g., monthly (LT]). Outcomes tend to be a mixture of these two variables. For example:
- A positive test (“case”) occurs when the infectious agent overwhelms the immune defense system; a short-term response may or may not have been bolstered by vaccination, a long-term response.
- Infection follows exposure through contact with previously infected individuals, moderated by social distancing; masking is a short-term response.
- Ambient exposure depends on the spatial density of exposed individuals, duration of contact, and ambient ventilation, rendering it spatial and short-term.
This categorization facilitates separate consideration of temporal and spatial variability and their interactions.
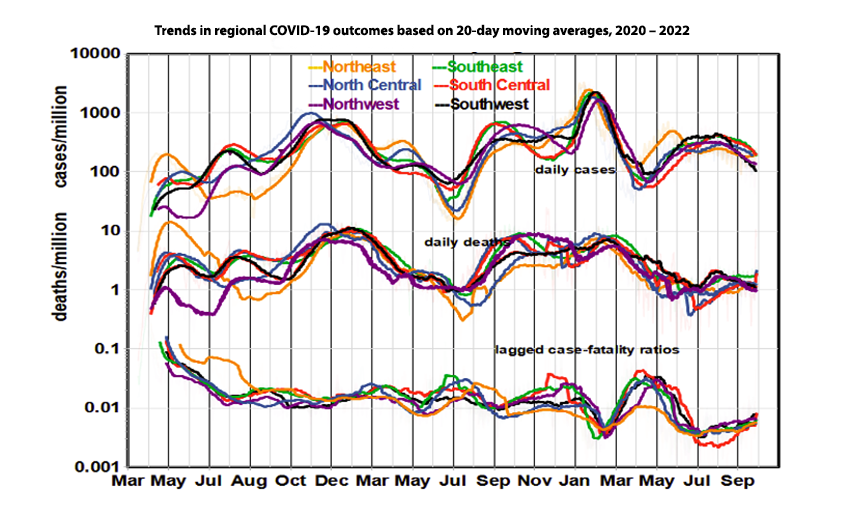
Long-Term Regional Trends
The regional graphs show that spatial relationships have been changing over time. For example, Northeast infection rates were initially the highest in the nation but dropped to the lowest levels in the fall of 2020 and now rank high again. Cases and deaths increased steadily during the first eight months of the pandemic and peaked from November to January before the original vaccination program got underway.
Long-Term National Trends
Daily case rates were in full retreat everywhere by February 2021 in response to the original vaccination program but bottomed out in summer as the vaccination rate plateaued. The case trend then reversed, perhaps due to the waning of vaccine efficacy. Coverage of the first booster peaked in January 2022, but the case rate rose again when the Omicron variant appeared on the scene. Case and death rates now appear relatively steady, at levels similar to averages over the entire pandemic.
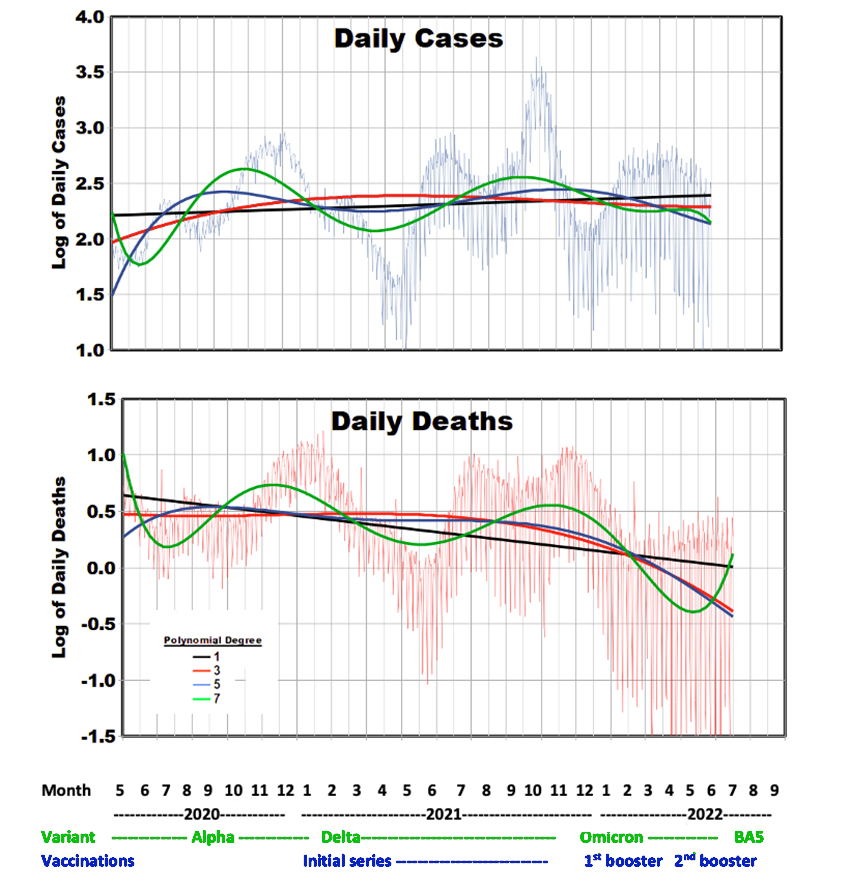
We used national data to examine long-term temporal trends in daily cases and deaths more closely in relation to changes in the dominant variants and vaccination program. We began this analysis in May 2020 to avoid the steep gradients at the beginning of the pandemic. Our linear equations indicate that, on average, daily case counts increased from 53,520 to 82,500 while daily deaths decreased from 1454 to 316. Overall, case rates increased by about 50% during the pandemic, while death rates decreased by about 75%.
In the graphs of daily cases or deaths, we fit the data to polynomial equations of different degrees, intended to portray the shape of the temporal relationships as opposed to outcomes on specific dates. This approach considers the progress of daily outcomes to be mathematically connected according to polynomials of different shapes. [1] Higher polynomial degrees resulted in a greater correlation to cases and deaths, but none exceeded 0.60. Because of the large number of observations (908 days), all of these correlations are statistically significant. The empirical relationships shown in the graphs do not represent the relative magnitudes of these peaks and valleys.
Only about 60% of the population has received both original shots, and only about half of those received the booster. Overlayed on these relatively short-term trends is the likelihood of seasonal effects resembling influenza, most likely due to increased indoor exposure. The second booster program may have reduced death rates during the beginning of the Omicron variant period but then increased due to the waning of the first booster. A third booster shot is now available, appropriately timed for the waning of the second one.
The strong increase in daily variability as the pandemic progressed (shown by the background data) is an essential characteristic of these data, possibly due to diversity in vaccination coverage and face mask usage.
Detailed Trends with Variants and Vaccinations
- Virus transmission and spread were high during the early pandemic in 2020, despite varying quarantine and face mask mandates that thus must be judged as largely ineffective.
- 2021 essentially offered an object lesson in how not to control a pandemic. The original vaccination program effectively ended at only about 60% of its goal, and the protection of those vaccinated waned during the lengthy campaign to extend coverage. As the (first) booster program designed around the Delta variant got underway, the Omicron variant arrived and took over. A second booster program was aimed at the Omicron variant, which evolved into a stronger sub-variant (BA-5) as plans were being made for a third booster vaccine.
- The total vaccine coverage is constrained because access to each booster is limited to those who had received previous shots, currently about 33% of the population. For comparison, it is discouraging to realize that only about half of the population gets a flu shot each year and that about 20% refuse flu vaccination on principle.

The graph of recent trends shows regional differences more clearly. The Southeast region now leads, in cases, the Southwest trials. Cases are generally trending downward while death rates hold steady, except in the Southeast. CFRs are tightly grouped. We also note a recent tendency for increasing death rate lag. The substantial increase in cases from May to June not seen in death rates corresponds to the arrival of the Omicron variant. Studies have shown that current vaccines are less effective against the Omicron variant than the Delta variant.[2] The end of COVID-19 is not in sight here.
So, where do we stand? Was President Biden on target?
Of course, the response to this question depends on the definition of “over” and the likelihood of a third seasonal cycle. [3] The most recent regional data show cases decreasing with deaths holding steady. CFRs thus increased even after accounting for lags, suggesting that the most recent Omicron variant (BA-5) might be more lethal.
It might be reasonable to define “over” as getting down to endemic [4] case levels, for example, as typically experienced from influenza [5]. The CDC estimates annual flu cases at 9 to 41 million, with a median of 19 million. Based on recent daily data, the current annual COVID caseload would be about 17 million, about the same as estimated flu illnesses. The CDC figures for flu deaths are 12,000 to 52,000, with a median of 25,000, while the current annualized COVID death count is 147,800.
On this basis, annual COVID deaths are now running about six times the estimated flu deaths; we still have a long way to go to reach tolerable levels. For example, based on linear extrapolation, we estimate that it would require about 14 more months under current COVID conditions to reach the average CFR for influenza (0.0013). It is unlikely that this gap could be closed by increased vaccination coverage alone.
[1] To characterize these connections, we hypothesized polynomials of increasing degree with respect to the number of days in the series (d), where n is the maximum polynomial degree:
Logarithm of daily rate = α + β1*d + β2*d2 + β3*d3 + ….. βn*dn
We evaluated the equation for polynomial degrees from 1 to 8 and used the correlation (R) between the smooth curve and the actual data as a measure of successful representation. The linear term (β1) is a measure of the overall trend, and the higher-degree terms are intended to characterize shorter-term behavior. Degree 2 is a quadratic relationship that allows one peak during the entire pandemic, while higher degrees allow successively more peaks with correspondingly shorter intervals.
We have amended our CFR algorithm to reflect lagging death rates better. Logarithms are base 10. Outcomes are expressed as daily events per million population.
[2] https://jamanetwork.com/journals/jamanetworkopen/fullarticle/2796615
[3] Will there be a COVID winter wave? What scientists say Nature Magazine
[4] An “endemic” disease is one regularly found among particular people or in a specific area.


