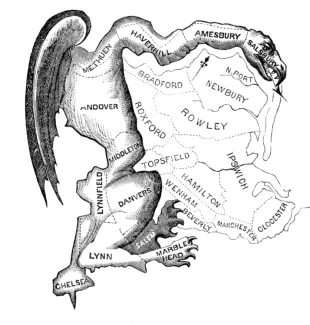
Last week the Supreme Court took up its 51st case involving gerrymandering. They have never struck down a lower court ruling, but perhaps this time is different because observational studies are under consideration. Before we jump in, here is a quick refresher about gerrymandering. Every ten years the US Census is performed and based on those results, state legislators realign their districts to meet a constitutional requirement that all districts have the same number of citizens. And every ten years, some legislators try to realign these districts to their political advantage. Using increasingly sophisticated techniques some legislators 'pack' districts "with large number of party supporters in relatively few districts where they win by large margins;” or 'crack' districts where party supporters are dividing “among different districts so that they do not form a majority in any of them.” In elections where popular vote applies (that means we are not talking about the Electoral College) cracking and packing tears away at the concept of one person one vote. Gerrymandering has been around since there have been elections and the term comes from the governor of Massachusetts in 1815 Elbridge Gerry.
The case currently before the Court involves Wisconsin’s state elections. Here is the breakdown of the election results:
|
|
Republicans |
Democrats |
||
|
|
Statewide vote |
Seats |
Statewide vote |
Seats |
|
2012 |
48.6% |
60 (60.6%) |
51.4% |
39 (39.4%) |
|
2014 |
52% |
63 (63.6%) |
48% |
36 (33.4%) |
There is clearly not a one to one correspondence between the percentage of votes and percentage of seats (representation). But is this because of a deliberate attempt to redistrict the population? When the Court previously considered a gerrymandering case, thirteen years ago, they rejected a challenge to a Pennsylvania Congressional redistricting 5 to 4. All of the justices felt that there should be some symmetry in the results, that 48% of the vote should get you about 48% of the seats, not 33%. But there was no test that could be applied to demonstrate that the results were due to gerrymandering rather than shifting populations. Justice Kennedy departed from his majority colleagues stating,
“I would not foreclose all possibility of judicial relief if some limited and precise rationale were found to correct an established violation of the Constitution in some redistricting cases…That no such standard has emerged in this case should not be taken to prove that none will emerge in the future. Where important rights are involved, the impossibility of full analytical satisfaction is reason to err on the side of caution."
Bottom line, with no readily applied test to demonstrate gerrymandering Justice Kennedy accepted the majority view. But his opinion prompted a search for a methodology that might show bias in redistricting that could be readily applied. Nicholas Stephanopoulos and Eric McGhee wrote a paper entitled Partisan Gerrymandering and the Efficiency Gap proposing a new measure of the bias introduced by gerrymandering, the efficiency gap - based on an observational study of our electoral results from 1972 to 2012. The efficiency gap is the new measure of bias and lies at the heart of the case now before the Court. Let me first explain the efficiency gap and then consider the results they found.
“Some voters cast their ballots for losing candidates (and so are ‘cracked’). Other voters cast their ballots for winning candidates but in excess of what the candidates needed to prevail (and so are ‘packed’). A gerrymander is simply a district plan that results in one party wasting many more votes than its adversary. And the efficiency gap indicates the magnitude of the divergence between the parties respective wasted votes. It aggregates all of the plan’s cracking and packing into a single number.”
For the winner, any votes over 51% are “wasted;” while for the loser, all votes are wasted. In an equally efficient election where each vote matters, these wasted votes will even out over geography (statewide versus a specific district) and over time. Equal efficiency in turning your votes into seats is a mathematical way of describing one person one vote. Here is McGhee’s and Stephanopoulos’s math. [1]
|
District |
Democratic Votes |
Republican Votes |
Democratic Wasted Votes |
Republican Wasted Votes |
Net wasted votes |
|
1 |
75 |
25 |
24 |
25 |
1 Republican |
|
2 |
60 |
40 |
9 |
40 |
31 Republican |
|
3 |
43 |
57 |
43 |
6 |
37 Democratic |
|
4 |
48 |
52 |
48 |
1 |
47 Democratic |
|
5 |
49 |
51 |
49 |
0 |
49 Democratic |
|
Total |
275 |
225 |
173 |
72 |
101 Democratic |
Of the 500 possible votes, 101 were ‘wasted,’ resulting in an efficiency of 101/500 or 20.2% The efficiency gap can also be calculated knowing the vote margin and seat margin.
Efficiency Gap = (Seat Margin – 50%) – 2 (Vote Margin – 50%))
Here is the calculation using Wisconsin’s results (either party’s result gives the same gap)
|
|
Republican Votes |
Efficiency Gap Calculation |
|||
|
|
Statewide vote |
Seats |
Seat Margin – 50% |
-2(Vote Margin – 50%) |
Efficiency Gap |
|
2012 |
48.6% |
60 (60.6%) |
10.6 |
-2(-1.4)=2.8 |
13.4 |
|
2014 |
52% |
63 (63.6%) |
13.6 |
-2(2)=-4 |
9.6 |
Here is what they found:
- “Both the congressional and the state house distributions had median efficiency gaps of close to zero and were roughly symmetric in shape. Contrary to claims that Republicans benefit from redistricting…the typical plan in recent decades has not been notably skewed in either party’s favor.”
- “…many plans either are balanced to begin with or can unravel in changing political circumstances.”
- “while a Republican advantage is more common, there are numerous examples of plans that strongly favor Democrats as well.”
- “plans’ efficiency gaps have become both larger and more pro-Republican over time.”

- “The average net gap indicates the overall partisan direction of gerrymandering, while the average absolute gap reveals its overall magnitude. The average net gap plots confirm … plans increasingly favoring Republicans over time.”
- “The story for the average absolute gap is somewhat different. At both the congressional and state house levels, it remained roughly constant between 1972 and 2010 (though with perhaps a slight upward tilt, especially from the 1980s onward). But it then spiked in the 2012 election to the highest peaks recorded in the modern era… The increase in the magnitude of gerrymandering thus is a very recent phenomenon, while the movement in the Republican direction dates back somewhat further.”
But some changes are due to population shifts how can you identify what might be gerrymandering? They set a threshold for outliers - the plans with the top 10% greatest efficiency gaps (for the statistically inclined 1.5 standard deviations) -for when bias is not merely due to population shifts but might be due to gerrymandering. The threshold was when plans demonstrate a gap of two seats in congressional races or an eight-point gap in statehouse contests. The authors propose to use this disparity as the threshold measure the court could apply reproducibly and easily to consider the possibility of gerrymandering. They note three limitations to the Court's use of their test.
- There may be “unexpected results that begin to emerge when one party receives an extraordinarily high vote share.” The author felt these to be rare ‘edge cases,’ that could be quickly flagged (a 75% vote share and 100% seat share) and ignored.
- The efficiency gap is “unstable over time.” The authors believe that this reflects a party’s vote share rather than a “weakness of the measure.” They point out that within districts party shares vary 5.5 to 7.5% over time
- The efficiency measure relies on a two-party contest; uncontested seats distort efficiency gaps. There is no readily applicable treatment in this setting and is perhaps the most significant weakness both from a scientific and legal point of view.
Stephanopoulos and McGhee end their paper with this paragraph, an eerie prophecy of the Court verbal arguments.
“…. At the Supreme Court level, however, we doubt that the currently sitting Justices are eager to launch another redistricting revolution. We would be surprised by an explicit rejection of the efficiency gap, …but we would be equally surprised if today’s conservative Court began striking down the largely pro-Republican gerrymanders that exist across the country. The Court’s more likely course is to let sleeping dogs lie.”
Here is an excerpt from Chief Justice Roberts comments, comments that raised a few concerns among social scientists:
Chief Justice John Roberts, who's known for a desire to safeguard the high court's reputation, was unusually blunt about his concern that opening the door to partisan gerrymandering cases would flood the Supreme Court docket with litigation and drag the justices into a political morass. He said voters will look askance at the notion that districts failed to meet a complex formula that assesses wasted votes and a so-called "efficiency gap."
"You're taking these issues away from democracy, and you're throwing them into the courts pursuant to—and it may be simply my educational background, [what] I can only describe as sociological gobbledygook," the chief justice opined. "The intelligent man on the street is going to say, 'That's a bunch of baloney. It must be because the Supreme Court preferred the Democrats over the Republicans.'...That is going to cause very serious harm to the status and integrity of the decisions of this court in the eyes of the country." [2]
I would respectfully disagree with the Chief Justice; I think we have some useful information to consider. It might not be sufficient as a test, but it is a good beginning. Gerrymandering, by whichever party, disenfranchises voters, it allows representatives to pick their constituents rather than constituents choosing their representatives. It turns primary elections, where partisans are the most vocal and active, into our real elections, contributing to the polarization and paralysis of our legislative institutions. We need to take a serious evidence-based look at what we are doing. The efficiency gap may not be our best final solution, but it is much better than doing nothing.
This article was inspired, in part, by RadioLab’s webcast series More Perfect. The episode is entitled Who’s Gerry and why is he so bad at drawing maps. More Perfect “dives into the rarefied world of the Supreme Court to explain how cases deliberated inside hallowed halls affect lives far away from the bench.” It is their second season, and you learn something with every webcast. I cannot recommend it enough.
[1] How the Efficiency Gap Standard Works
[2] Supreme Court eyes partisan gerrymandering
SaveSave

Chuck Dinerstein, MD, MBA
Director of Medicine
Dr. Charles Dinerstein, M.D., MBA, FACS is Director of Medicine at the American Council on Science and Health. He has over 25 years of experience as a vascular surgeon.


