
Candidate Gobermouch is leading in the polls over Candidate Fopdoodle, 48% to 43%, a difference of 5 percentage points. The poll's margin of error is 3%. Does Gobermouch have a lead over Fopdoodle that is outside the margin of error?
Many American political pundits would say yes, but the answer is no. Well, it's complicated. It's probably no. The following statistics concepts (as applied to polling) explain why.
 1) Confidence intervals communicate information better than margins of error. A margin of error of ± 3% means that Gobermouch's support could be as high as 51% but as low as 45%. Similarly, Fopdoodle's support could be as high as 46% but as low as 40%. Those ranges, more appropriately called "confidence intervals," overlap. So, Gobermouch's support is not "outside the margin of error." (There is another serious error in this logic. See more below in #2.)
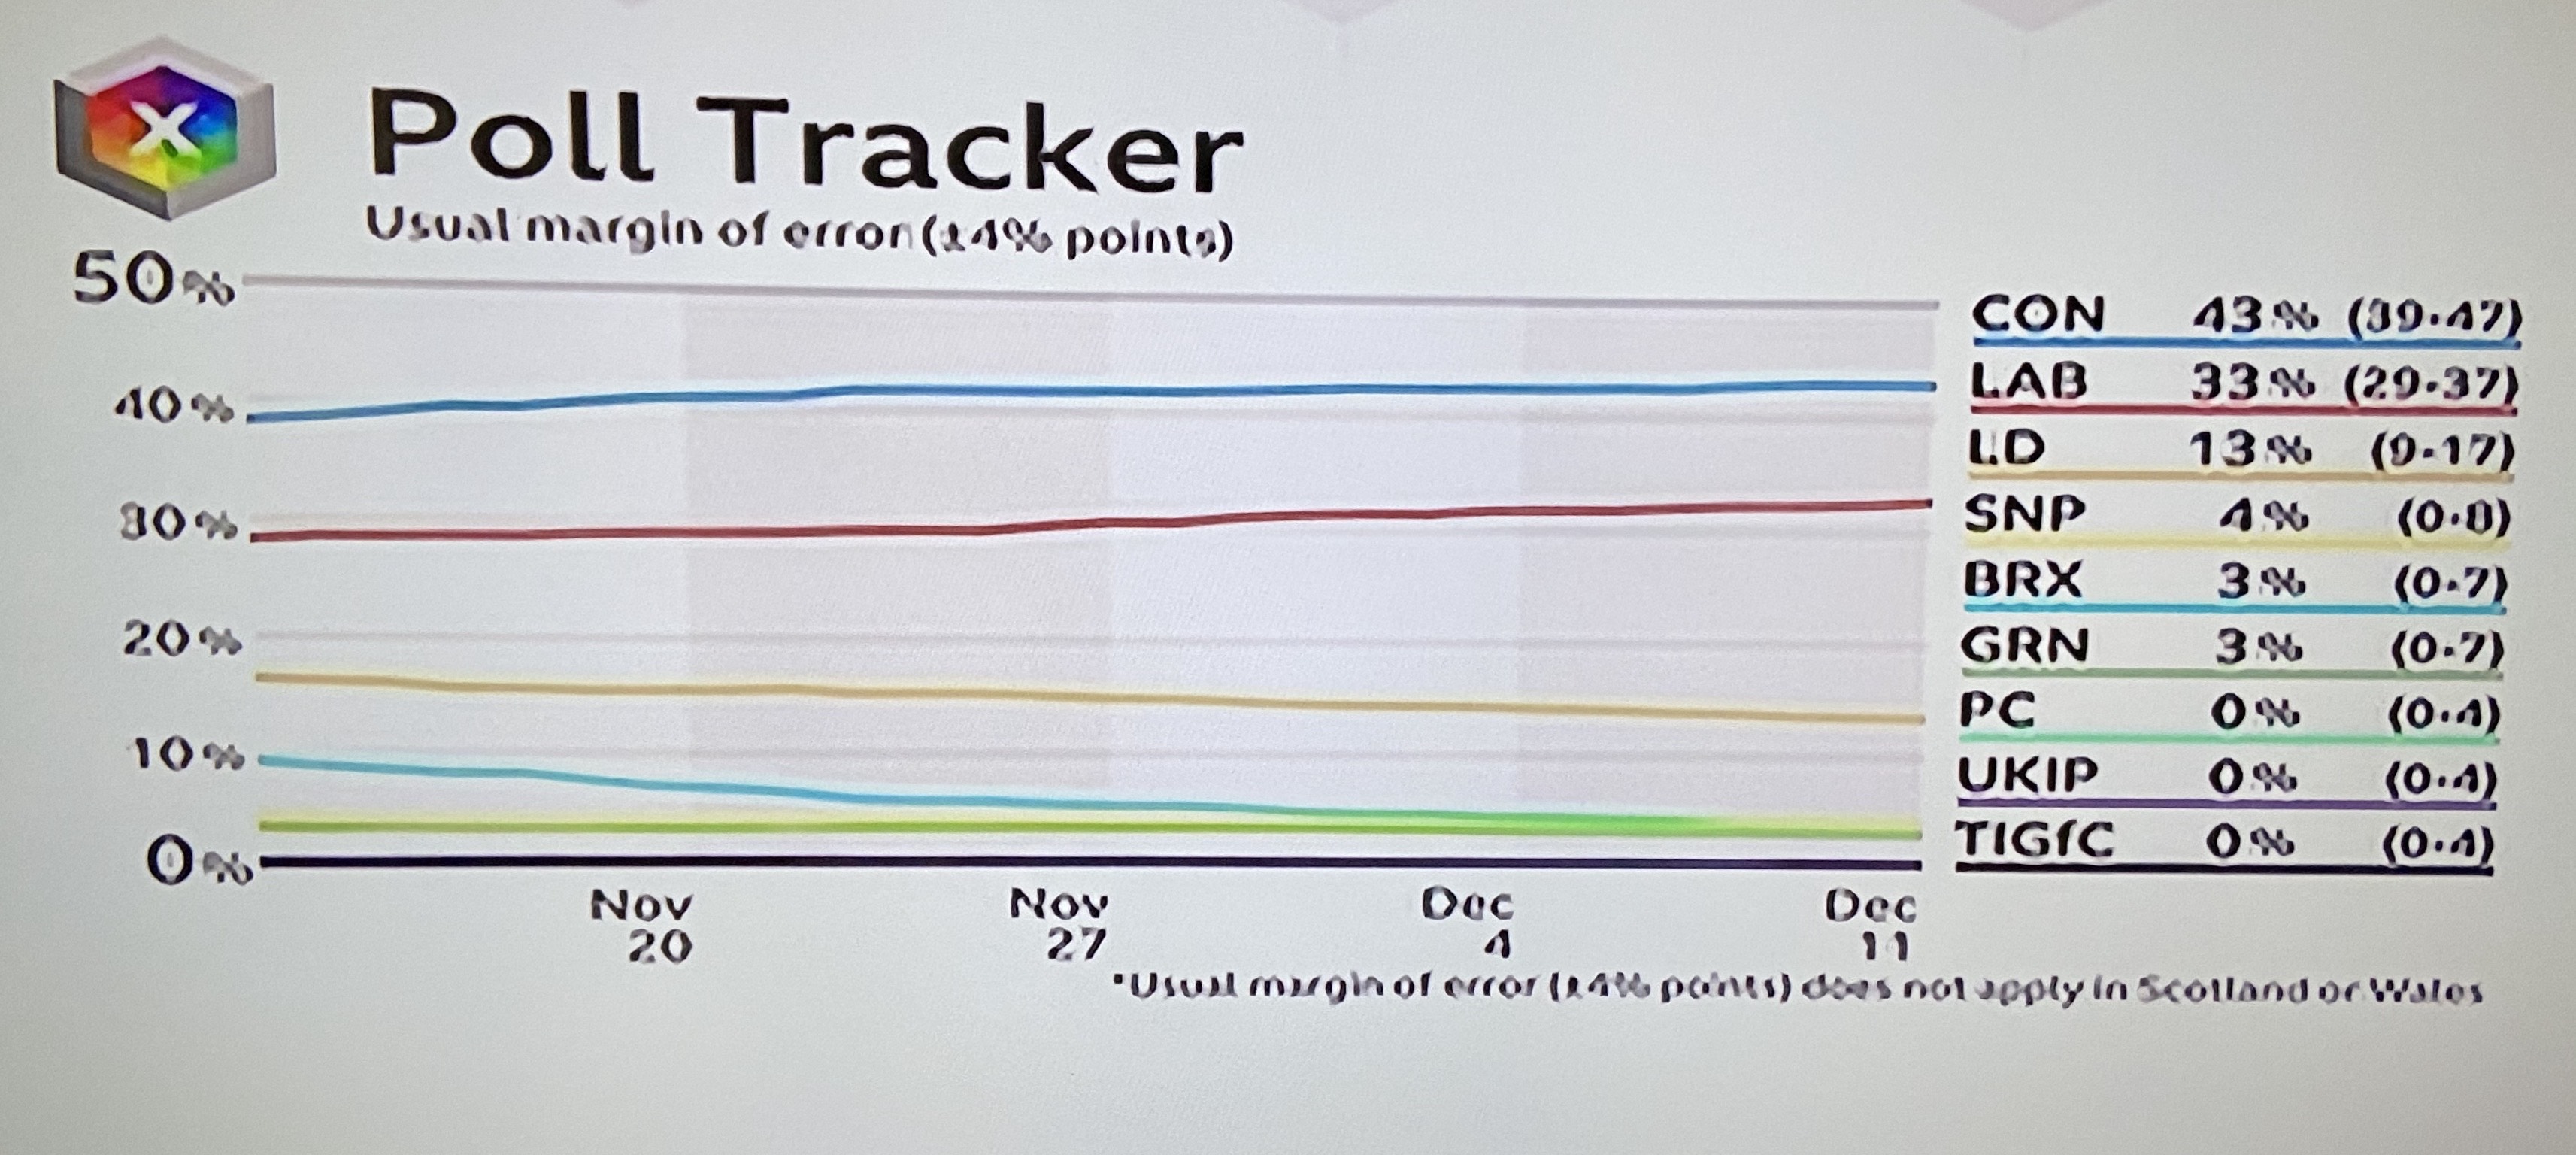
Prior to the recent general election, the BBC displayed a margin of error along with confidence intervals for voting intention. Note that with a ± 4% margin of error, polls predicted that the Conservatives could expect anywhere from 39% to 47% of the vote, while Labour could expect 29% to 37% of the vote.
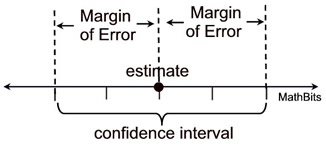
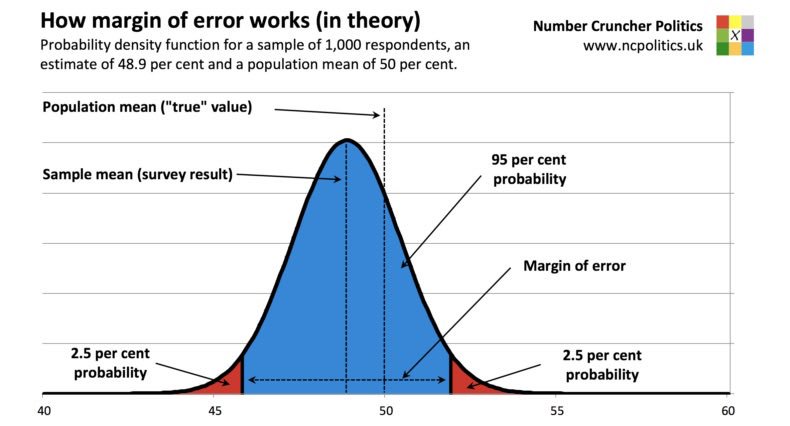
What do confidence intervals mean? Quite simply, a confidence interval (which is most often a "95% confidence interval") means that the "real answer" will fall within the calculated range 95% of the time.
In other words, if the pollsters repeated their survey 100 times, 95 of the ranges they calculate would contain the "real answer" and 5 would not. That's right. Even the best pollsters will get it wrong 5% of the time. (And this does not take into consideration systematic bias in sampling.)
2) The polling results were not designed to answer the question, "Is this candidate's level of support outside the margin of error?" The reason is nitpicky and nuanced, but it actually matters.
Polling data shows us the pollsters' best guess as to the level of support for a candidate. In our example, Gobermouch is at 48% (with a confidence interval of 45% to 51%) and Fopdoodle is at 43% (with a confidence interval of 40% to 46%). However, "Is Gobermouch's lead over Fopdoodle statistically significant?" is a different question and requires a different statistical approach.
Though we don't think of it this way, the actual question we're asking is: "If we subtracted Fopdoodle's support from Gobermouch's (or vice versa), would the result be zero?" If the result is zero (or if the confidence interval contains zero), then there is no statistically significant difference.
But here's the tricky part: You can't know this by simply determining if the confidence intervals for each candidate's support overlap. You have to look at the confidence interval for the difference in their support levels.
In our example, the difference in support levels is 48% - 43% = 5%. This difference may or may not be statistically significant. To determine if it is, we would need to calculate a confidence interval around 5%. If it included 0%, then there is no statistically significant difference between Gobermouch and Fopdoodle.1
Why is this seemingly easy question so complicated? The reason has to do with error propagation, and PhD student Prasanna Parasurama provides an excellent explanation of this phenomenon.
3) Not all numbers within the confidence interval are equally likely. An important thing to keep in mind is that the numbers within a confidence interval get less likely the farther you go away from the estimate. In our example, Gobermouch's support was estimated to be 48% with a confidence interval from 45% to 51%. But the "real answer" is much more likely to be closer to 48%. In other words, the "real answer" is more likely to be 47% or 49% than 45% or 51%.
4) When a candidate's support slightly increases (or decreases) in a poll, the most likely explanation is that nothing happened. Let's suppose that, in a subsequent poll, Fopdoodle's support increases to 44% while Gobermouch drops to 47%. Fopdoodle's team issues a press release: "Fopdoodle surges in polls, closing gap with Gobermouch." Is he right?
Probably not. The most likely explanation is the inherent randomness of sampling.2
5) None of the above matters if there is systematic bias in sampling or a serious problem with the recipe. Sampling in statistics relies on randomness. If a pollster violates randomness, he introduces bias into the sample. This can have disastrous results. If a pollster only contacts voters with landline phones but not cell phones, he may be missing a large number of young people and inadvertently skewing his poll to favor the views of older voters.
There are methods to handle this problem. If a pollster knows that he over- or under-sampled a particular group of voters, he could "weight" the sample to offset the bias. But what if he gets the weight wrong? Similarly, election models often rely on previous patterns in voter turnout. But, once again, what if the current election does not follow the pattern of previous elections? These kinds of "recipe" problems can also spell disaster for a pollster.
In 2016, pollsters and the media famously flubbed predictions in regard to the UK Brexit referendum and the U.S. presidential election. If only we all knew a little more statistics!
Notes
(1) Having said all that, I consulted with a friend and PhD statistician, Stefan Sharkanksy. He told me that while it is generally true that confidence intervals don't necessarily combine cleanly, there is still a relatively easy way for the average person to get an answer that is "good enough." If you double the margin of error (in our example, from ± 3% to ± 6%), then you can see that the difference (5%) is within the margin of error. This isn't quite technically accurate, but it works well enough when comparing candidates from the same poll.
(2) Dr. Sharkansky said there is actually a straightforward formula to determine if the new poll reflects a statistically significant change in voter support. If both polls have the same margin of error, then the margin of error for the difference is the margin of error times the square root of 2. In our example, that comes to ± 4.24%. Because the difference in voter support changed from 5% to 3% (which is a difference of 2%), this change is within the margin of error (± 4.24%) and therefore not significant.

Alex Berezow, PhD
Former Vice President of Scientific Communications
Dr. Alex Berezow is a PhD microbiologist, science writer, and public speaker who specializes in the debunking of junk science for the American Council on Science and Health. He is also a member of the USA Today Board of Contributors and a featured speaker for The Insight Bureau. Formerly, he was the founding editor of RealClearScience.


