
The New York Times published the results of a national survey of face-mask utilization in July 2020. [3] The results were given in terms of fractions of the survey sample that reported wearing a mask always, frequently, sometimes, rarely, or never. We averaged these data by state and combined the five survey categories to derive a single composite mask usage score for each state, for which “always” wearing a mask was given a rank of 5 and “never” was ranked as 0. We multiplied the mask scores by 1000 for convenience; the mean score was 297. We also developed a ranking of states based on the regulatory comprehensiveness of mask use [4]. It runs from zero (GA, ID, IA, ND, SD, TN, UT. WY) to 5 (AR, CA, DC, PA), with a mean value of 2.3. This regulation score was correlated significantly with our mask usage score (R=0.60).
The table shows those and other relevant statistics.
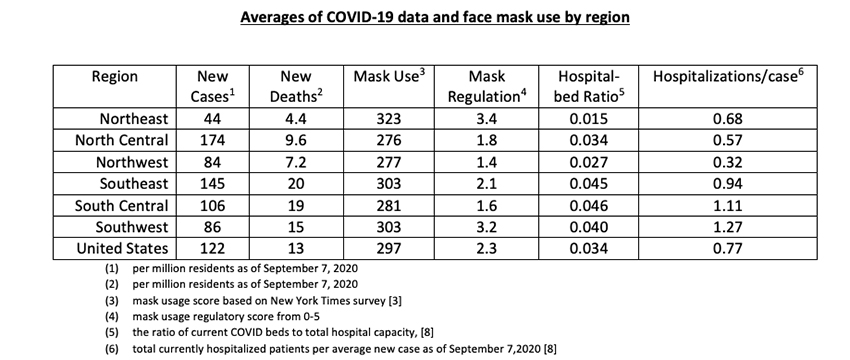
The data demonstrate critical regional differences. The Northeast has the least new cases, the most frequent mask usage, the tightest mask regulations, and the lowest proportion of COVID hospital beds, but the highest cumulative COVID hospitalizations (resulting from earlier conditions). The North Central Region has the highest rate of new cases and the lowest frequency of mask use. The three southern regions have the highest rates of new deaths, fractions of COVID hospital beds, and ratios of hospitalization to new cases.
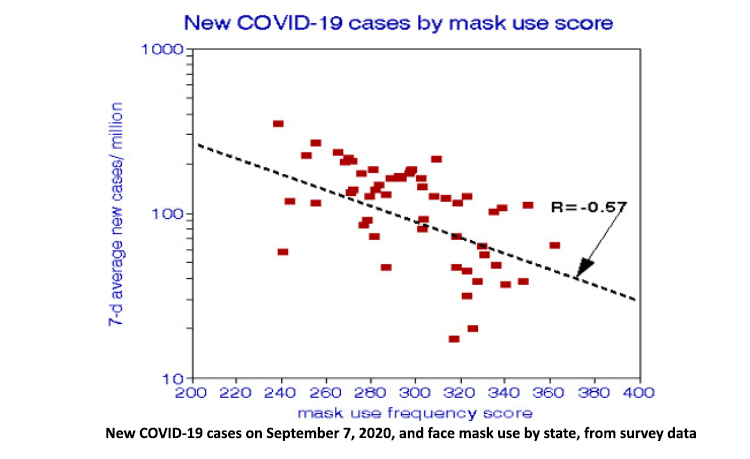
We tested the hypothesis that new COVID-19 cases are inversely associated with face mask usage. Based on the New York Times reports of 7-day average new cases [5], we found a highly significant correlation coefficient of 0.57; the data are shown in the figure. [6] These data indicate less frequent mask usage in the northwest and 40% more in the Northeast, corresponding to nearly an order of magnitude fewer COVID-19 infections. This relationship was weaker for previous rates of new cases.
The regression line slope of Figure 1 corresponds to about 4000 new cases per million with no mask usage. Complete (100%) mask usage would correspond to less than one infection per million residents, fewer than reported by any country, e.g., South Korea reported ten new cases per million population. The mask regulation score was significantly correlated with new COVID-19 cases (R=0.39), thus reinforcing our findings from the mask use survey. According to this additional statistical relationship, the predicted range in new patients would be from 56 to 152 per million population, and losing 1 point in regulatory score would increase new cases by about 20%.
Our mask usage score is by far the strongest predictor of COVID-19 effects that we have yet found in our COVID-19 studies. A useful measure of such strength of this effect is the slope of the regression coefficient in logarithmic coordinates, where the change in COVID-19’s effect varies with the change in a predictor level such as mask use or population density. Reducing population density by 10% resulted in a reduction in 10% of deaths, a slope of 1. For masks, that slope is -3, a 10% increase in the use of masks would reduce new COVID-19 cases by 30%. Doubling the use of masks could reduce new cases by a factor of 10.
Because it seems unlikely that face mask usage could be entirely responsible for the range in new COVID-19 infection rates, we investigated several other potentially confounding risk factors: population density, race, and air pollution. Although they are significant predictors of cumulative COVID-19 mortality [7], they are not predictive of daily changes nor cumulative cases. When combined with mask use, these other predictors contributed little to the predictive value of wearing masks alone.
Unlike geography, race, and environmental conditions, mask use is determined by individual behavior. We are not powerless in the face of this virus. Wear your mask. Don’t wait for Halloween.
[1] Filtration Efficiency, Effectiveness, and Availability of N95 Face Masks for COVID-19 Prevention. JAMA Internal Medicine DOI: 10.1001/jamainternmed.2020.4218.
[2] Air Pollution and COVID-19: To Stay In or Get Out?
[3] A Detailed Map of Who Is Wearing Masks in the U.S. New York Times
[4 State-by-State Guide to Face Mask Requirements , press release from American Association of Retired Persons
[5] COVID World Map: Tracking the Global Outbreak New York Times
[6] Vermont, New Hampshire, and Maine were low outliers in this data set with few new cases per 100,000 residents, and we omitted them from this analysis.
[7] Every Picture Tells a Story: For COVID-19 Mortality, Does Geography Matter?
.


