
To standardize for differences in population, we present these data on the basis of one million persons. We used 10-day centered moving averages to smooth out daily fluctuations. CFRs may reflect the age demographic or the efficacy of subsequent medical care.We focus on the preceding five months (September to February) in highlighting recent trends. This period includes major holidays, during which rates were expected to increase due to relaxed social distancing.
Figure 1 shows daily trends for COVID-19 cases, associated deaths, and their ratios (CFRs).
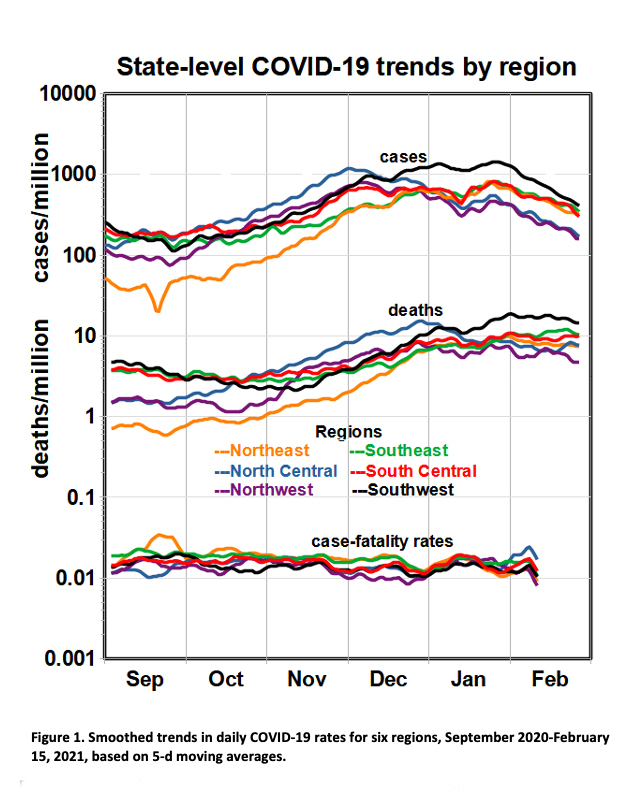
- COVID-19 rates were the lowest in the Northeast and highest in the Southwest and North Central regions.
- Death rates nearly doubled from September through December
- Infections increased by nearly an order of magnitude
- These infection and death changes resulted in slightly fluctuating CFRs with a mean value of around 1%.
- By mid-December, death rates for all regions except Southwest had coalesced into a common pattern that lagged case rates by a few weeks.
- Cases began to decline at the end of January in all regions while deaths held steady.
- CFRs have essentially been flat at about 1.3%.
Annual COVID-19 deaths are on track to exceed one million per year and become the leading cause of death in the U.S. Maximum case rates found in the North Central and Southwest regions are slightly more than 1000 per million persons per day or about 0.1% - the national average case rate is almost half of that.
It is always problematic to predict the future based on a few months’ data. Still, should this maximum infection rate continue through 2021, the probability of infection during the year could exceed 30%. However, Figure 1 shows cases beginning to decline in January, and they have continued to do so at this writing. It might require about one year for case rates to drop to pre-pandemic levels at this rate of decline, assuming no further outbreaks.
The regional patterns fluctuated over time, precluding fixed geographic factors like population density as major responsible factors. Since we may assume that the virus has spread throughout the nation by this time, we must assume that patterns in exposure avoidance (social distancing, use of face masks, etc.) or the lack or presence of susceptible hosts may be responsible for these variations. No plausible hypotheses have been advanced for the order-of-magnitude increases in cases and deaths since September.
The Holidays
The Thanksgiving and Christmas holiday periods are of particular interest because of relaxed social distancing and increased exposure to the virus, as suggested in the media. However, Figure 1 provides no supporting evidence. Case rates increased steadily from October in all regions and leveled off in early December. They declined after Christmas and the New Year except for the Southwest, where they leveled off. Note that fluctuations in specific states might not be apparent in the regional averages but that effects of national holidays would be expected to persist.
This gloomy forecast suggests paying close attention to ongoing vaccination programs' success and continuing adherence to exposure avoidance.
[1] https://github.com/nytimes/covid-19-data
Regional definitions
Southeast – Alabama, Arkansas, Florida, Georgia, Kentucky, Maryland, Mississippi, Tennessee, Virginia, West Virginia, North Carolina, South Carolina, and District of Columbia
South Central – Kansas, Louisiana, Missouri, Oklahoma, Texas
Southwest – Arizona, California, Colorado, Utah, New Mexico, Nevada
Northwest – Montana, Oregon, Washington, Wyoming, Idaho,
Northeast – Connecticut, Delaware, Maine, Massachusetts, Pennsylvania, Rhode Island, Vermont, New Hampshire, New Jersey, New York
North Central – Illinois, Indiana, Iowa, Michigan, Minnesota, Nebraska, Ohio, Wisconsin, North Dakota, South Dakota.


