
Trends Over the Entire Pandemic.
Previously we showed that the trends in COVID-19 infections could be represented with a simple mathematical model that accounts for temporal trends, seasonal cycles, vaccinations, and the Delta variant, based on data through September 2021.
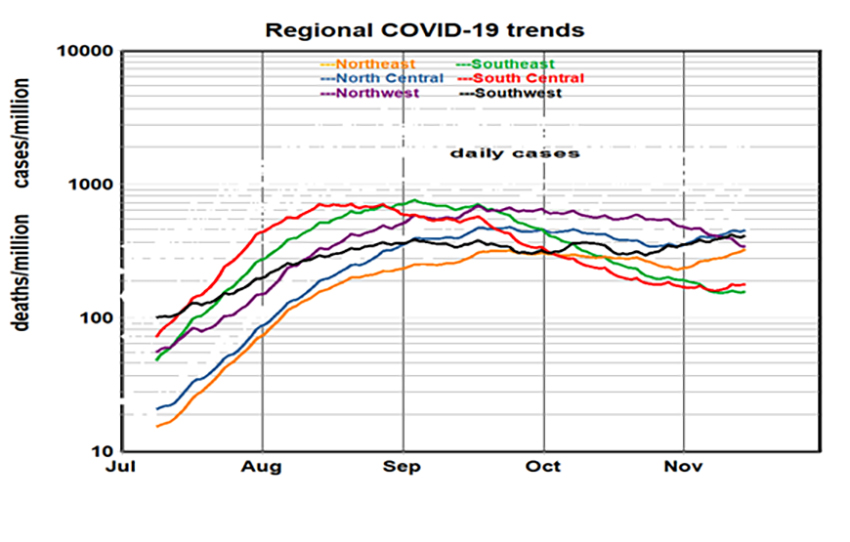
We used 7-day moving averages and logarithmic scales to smooth the trend lines and compare rates of change more readily, which are systematic, not random. The major trends are:

- Cases ranged 20-fold from highs in the 2020 winter to lows this summer.
- Deaths tracked cases, lagging by about one month, increasing during 2020 as the original virus spread throughout the nation
- Cases declined as cumulative vaccinations increased from January to July 2021.
- Case-fatality ratios varied up to 10-fold, indicating more fatal cases during March, May, July, and October 2021.
- Cases and deaths then increased sharply as the Delta variant spread during July and August.
- Regional rates varied inconsistently by up to 5-fold throughout the pandemic.
Vaccination has been the main virus control factor identified thus far; the role of infection-acquired immunity has been recognized but not quantified.
Summer and Fall, 2021.
Given the inconsistent lockdowns and mask mandates, speculation continues about the future progress of the pandemic. Infection trends that began this summer illustrate some of the conflicts.
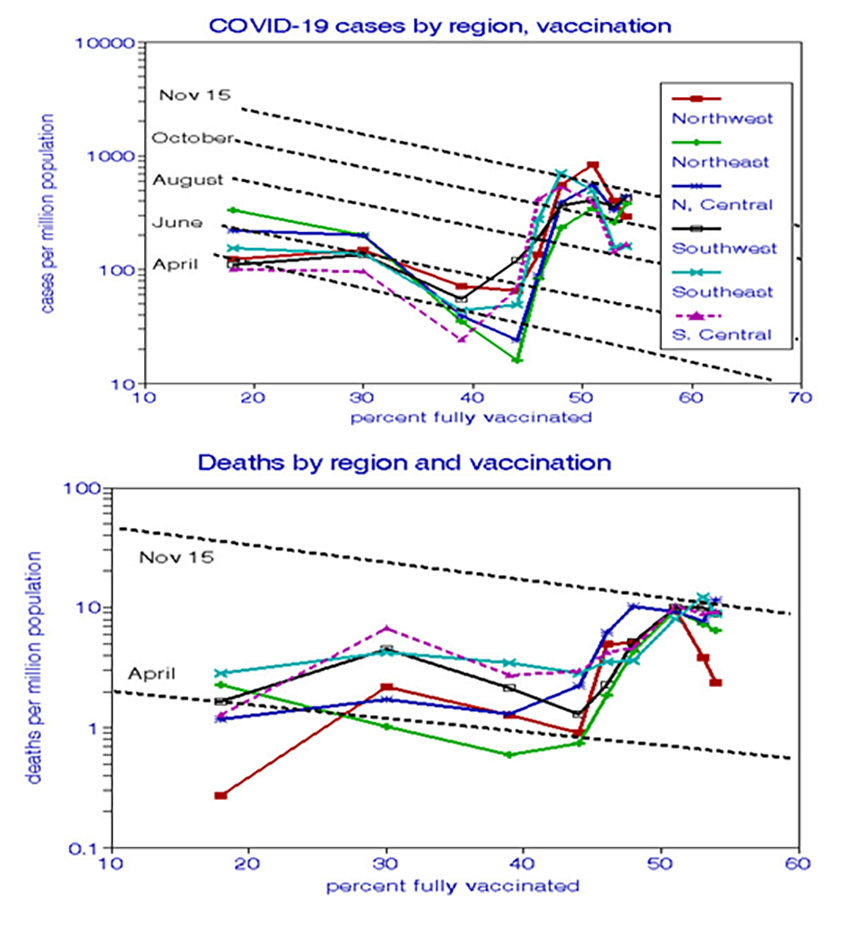
- Percentages of complete vaccinations increased during the summer, but cases and deaths also rose, contrary to expectations.
- Cases in the Southeast and South Central regions peaked in August and then decreased 3-fold.
- Cases in the South Central, Northeast, and North Central regions ticked upward in October.
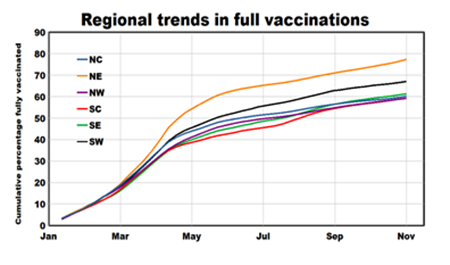 Vaccinations. Daily rates of complete vaccinations increased rapidly in all regions this spring to a peak of about 3 million in May, dropping to 600,000 in summer, and are now about 1.4 million. The Northeast and Southwest regions had consistently higher vaccination rates than the other regions, although all regions had similar rates of increase.
We quantified the overall temporal trends and the vaccination effects on cases and deaths from April through November. Both effects are statistically significant and do not differ significantly between cases and deaths. Rates doubled roughly every two months and decreased by about 5% for every percentage point in cumulative complete vaccinations. It appears that the advent of the Delta variant increased baseline rates nearly 10-fold until September, after which the benefits of vaccination may have resumed.
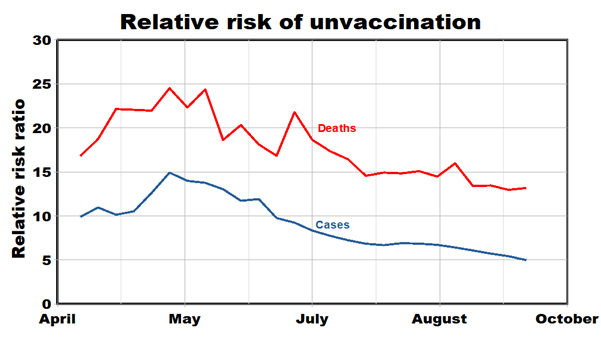
The Centers for Disease Control and Prevention (CDC) compared COVID-19 cases and deaths by vaccination status. We expressed these findings as relative risks: the ratio of rates for unvaccinated individuals to those previously vaccinated. They show much higher excess risks of death (24- to 13-fold) than risks of new infections (15- to 5-fold). Both types of risks decreased significantly over time (2-fold for deaths, 3-fold for cases), suggesting that immunities acquired from vaccination may have decreased after about four months. The Delta variant first appeared in July and may have contributed to the apparent decline in vaccine effectiveness.
Bottom Lines.
We found significant regional relationships between COVID-19 cases and deaths with time and vaccination rates, but neither persisted throughout the pandemic, and predicting future trends remains problematic. Clinical studies demonstrated vaccination effects, but the seemingly inevitable increases in COVID-19 rates over the entire pandemic have questioned their real-world efficacy, and vaccine effectiveness may have decreased since June 2021. We also show that national statistics can mask potentially important regional differences.
[1] https://github.com/nytimes/covid-19-data/blob/master/us-states.csv


