
The long view
This winter, we experienced new highs in cases but not in deaths, similarly, across all regions. [1]
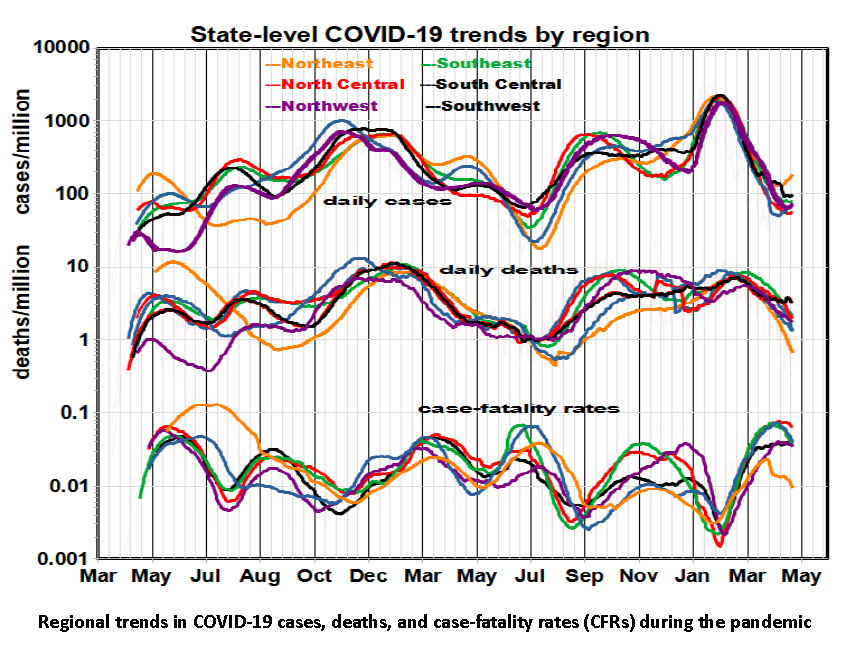
Overall, case rates varied by about 100-fold; death rates, about 12-fold; case-fatality rates (CFRs), about 30-fold. The deadliest regions shifted from the Northeast at the beginning of the pandemic to the Southeast and North Central in the winter of 2020, and then to the Southeast and North Central last fall, with few regional differences this past February.
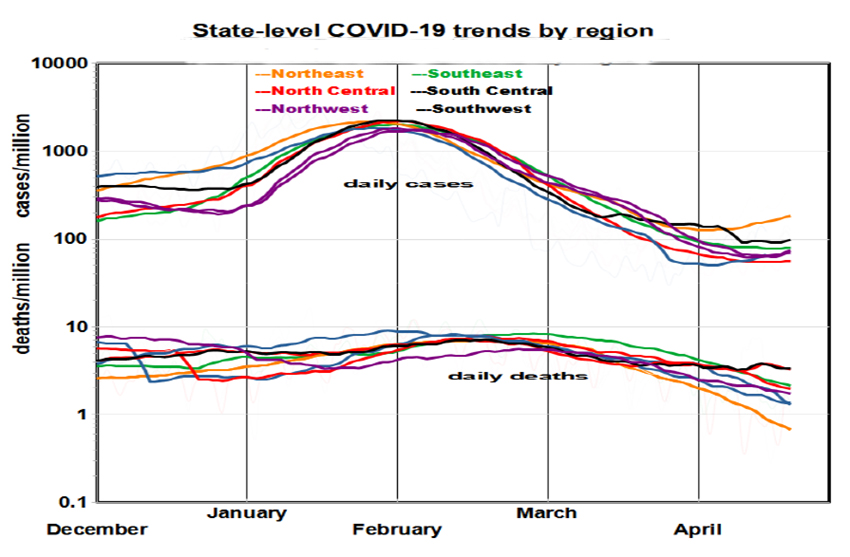
During the pandemic, virus variants with differing infectivity and severity emerged. The vaccination program began in January 2021, with the first “booster” last fall and the second recently. It appears that variants and vaccination rates interacted, creating regional heterogeneity. Cases showed accelerating growth and decline during the fall of 2020, late summer 2021, and January 2021. Death rates followed suit with a lag of 2-3 weeks. The period beginning last fall is notable, as depicted to the right. That sharp rise in cases, but not deaths, is consistent with the characterization of the prevalent Omicron variant as being more contagious but less virulent.
The variations in case fatality rates, CFRs, are particularly striking. How could the lethality of the dominant variant range ten-fold, from 1% to 10% over about four months nationally? While daily data tend to be noisy, random error is not the answer, nor are regional idiosyncrasies. Previously, we examined possible explanations for regional variability, including demography, housing conditions, income, education, political preference, and vaccination coverage.[2] However, except for vaccination rates, these candidate predictors remained constant during the pandemic, precluding application to trend analysis. The waning of vaccine-induced immunity may be a potential factor.

Defenses against COVID have included social distancing (not always feasible), face masks (not always consistently used), and vaccination (resisted by many and with waning effectiveness over time). Vaccination has sure-fire benefits with hospitalization dominated by the unvaccinated, but less than one-third of the population has been boosted. The graph shows how daily vaccination rates have declined sharply since May 2021 for the original series and since December for boosters.
In comparing cumulative vaccination rates with COVID’S health impacts
- The declining morbidity and mortality of last year (January – July) roughly correspond to the first vaccination program – although the decline began before vaccination got underway.
- Six months later, the morbidity and mortality trends reversed as the Delta variant began to dominate.
- The initial booster program peaked in early winter, coinciding with the sharp decline in infection rates.
- The current uptick (which may or may not continue) corresponds to the leveling off of those boosters, which has only reached one-third of the population. We would anticipate additional waning effectiveness.
Where does this leave us?
Statistical analysis, however interesting in its own right, is of little help in predicting the future. The efficacy of vaccines is well established in protecting recipients, but benefits to public health may be less obvious, in large part because of incomplete national coverage. It seems clear that future coronavirus variants will continue to have their way with us.
[1] We present these data as events per million population in six regions, smoothed by 50-day moving averages.


