
Come gather ‘round people wherever you roam
And admit that the waters around you have grown …
For the times they are a-changin’. Bob Dylan
A clearly defined chain of events is required to understand cause and effect, like these hypothetical environmental scenarios:
- After several days of rain, a river rises, a poorly designed dam is breached, and some downstream people drown.
- Lightning strikes in a dry forest, underbrush ignites, fires spread, and homes are destroyed.
Climate change [1] is different; billions of individual actions combine to affect everyone through ensuing changes in the global atmosphere. Studying the accumulation of atmospheric greenhouse gases is an example of nested agent-based modeling, in which individuals (agents) engage in activities resulting in emissions that collectively determine state-level atmospheric averages, which in turn determine a national average as modified by surface emissions less deposition and meteorological variability. This process continues as national effects are combined to comprise a global average, noting that the sum of averages is not the same as the average of the sums.
Who is responsible for what? To get at an answer, I use publicly available data on:
- Trends in national and global emissions, some back to 1880 but most from 1960 onward.
- Global atmospheric surveillance measurements.
- Frequencies of hurricanes.
- Changes in ocean depth expressed as sea level rise.
- Gross domestic product per capita (GDP) as a measure of overall economic activities requiring expenditures of energy and CO2 emissions.
Global Warming (GW) Agents
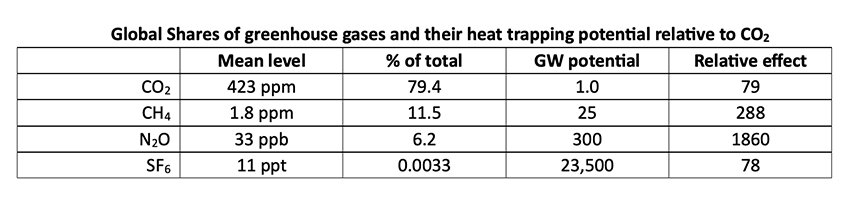
Just as a glass roof can reflect and trap internal heat, i.e., the greenhouse effect, certain constituents of our atmosphere can trap the earth’s emitted internal heat energy that would otherwise have been lost to outer space. Those constituents contributing to our global warming include:
- Carbon dioxide (CO2) resulting from burning carbon-based (fossil) fuels.
- Methane (CH4) the main ingredient of the natural gas used to generate electric power, cooking, and heating. [2]
- Nitrous oxide (N2O) from agriculture and industry.
- Sulfur hexafluoride (SF6) a synthetic gas mainly used to insulate high-voltage equipment.
- Elemental black carbon particles (EC) that can absorb heat produced from incomplete combustion.
- Reflective particles such as sulfate (SO4) aerosols produced by burning sulfur-bearing fuel.
 Trend Analysis
 The graphs show the cornerstones of the global warming issues:
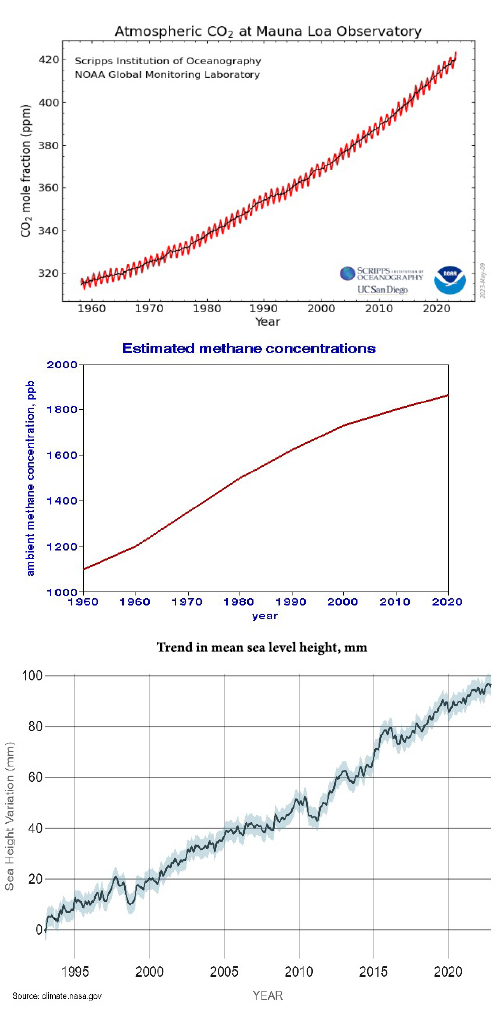
Similar trends are seen in atmospheric CO2, estimated ambient methane, and global mean sea-level rise.
The CO2 relationship, known as the “Keeling Curve” after its originator, maybe the most consistent atmospheric dataset extant. The cyclical variations result from seasonal meteorological changes such as ocean temperature. The inflection after 1990 may result from the 1987 Montreal international agreement limiting the use and emissions of chlorofluorocarbon refrigeration compounds with global warming properties.
Early GW concerns were based on the known heat-trapping properties of carbon dioxide (CO2) and Keeling’s ambient measurements from a remote location in Hawaii. Those data show that CO2 accumulates in the atmosphere, unlike other air pollutants that come and go with weather and season. The implication is that of irreversibility; today’s airborne CO2 may remain aloft almost indefinitely - a longevity to consider when evaluating the potential benefits of emission reductions.
Global methane is less well described than global CO2, in part because of poorly characterized local sources.
An important property of the global climate is its temporal stability; today’s influential factors will likely be there tomorrow, making temporal predictions much more reliable than predicting our daily weather.
Relationships
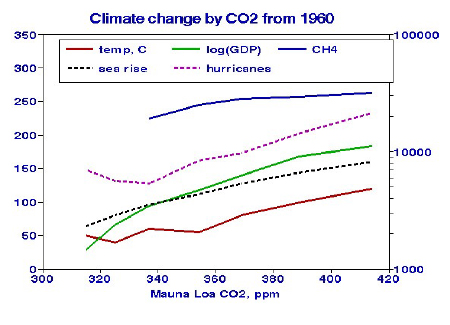 I found that the CO2 data could be nearly perfectly represented by an empirical quadratic function that predicts a CO2 level of about 500 ppm for the year 2050. At that level, this simple trend analysis would predict
- a global mean temperature increase of about 1.7oC
- a global average sea level rise of about 9 inches
- about 60 hurricanes per year in the US.
The temperature and sea level rise projections are similar to those from complex climate modeling [3]. All parameters increased in concert with global mean CO2, but methane leveled off.
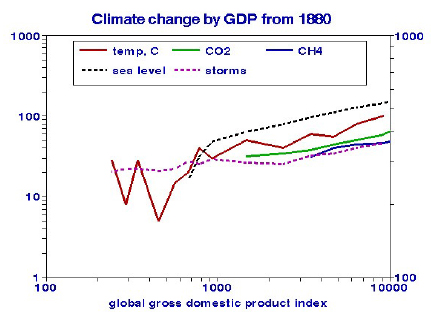 While we expect direct relationships with temperature, sea level rise, and annual storm frequency, any relationships with Gross Domestic Product (GDP) would necessarily be indirect. For comparison, I plotted the GW data against GDP; all parameters rose with GDP.
This analysis focused on CO2 as the most prevalent and persistent of the known greenhouse agents.[4] Methane's (CH4) lower prevalence is balanced by its greater heat-trapping capabilities and shorter atmospheric residence time. There are other differences:
- CO2 is a natural part of our atmosphere, crucial in making our planet livable.
- Measures of systematic ambient methane are limited, but reducing its anthropogenic sources would be economically efficient by reducing wasted energy.
Is Global Warming Real?
Skeptics, comprising roughly 15% of the US population, seek explanations for the observed global temperature rise other than increasing CO2, such as:
- Natural fluctuations - No previous periods of prolonged parallel increases in temperature and CO2 have been observed in more ancient trend data characterized by forest tree rings and ice cores.
- Conspiracies – Scientists seeking publicity and funding will bend science to the highest bidder. Those bidders include environmental activists, corporate and state actors seeking financial gain. Costs and benefits accrue unevenly on a global basis.
- Economic concerns - Some may contend that economic growth should prevail over any accompanying environmental degradation. But on a global basis, those nations most likely to suffer (having low-lying coastal regions) differ from the regions with the highest CO2 emissions having large supplies of fossil fuels.
Recapitulation
I have described these GW issues by projecting the available data while the IPCC relies on complex atmospheric modeling. The overall findings of the two approaches are similar. My analysis is based on the Keeling CO2 data, which conforms to a quadratic curve with extraordinary precision: a correlation coefficient of 0.999 and a mean CO2 prediction error of 0.65%. This provides strong confidence that global CO2 will approach 500 ppm by 2050 if present conditions persist. Ensuing increases in global temperature, sea level rise, and storm frequency are much less certain but are based on assumed continuity: what happens with 500 ppm CO2 will be worse than at 400 ppm.
No one individual is responsible for climate change; all of us are; the strongest among us should feel obliged to help others. The “hindmost taken by the devil” may turn out to include us.
[1] The synonym “climate change” has largely supplanted “global warming,” encompassing other presumably related changes such as precipitation patterns, ecosystem changes, ocean acidification, etc., that are well beyond the scope of this effort.
[2] Methane emissions from facility leakage are a small fraction of natural gas production.
[3] I found no modeled projections of hurricane frequencies for comparison.
[4] The graphs show roughly parallel temporal trends for CO2, CH4, per capita GDP, global mean temperature, sea level rise, and hurricane frequencies. I used linear regressions to quantify these relationships and let the numbers tell the stories. Those numbers are the t statics for each independent variable, the ratio of the slope (multiplier of temperature change) to its standard error. With these data, t values > 2.6 would be statistically significant. I used the logarithm of GDP because of its extraordinary range of values compared to the other parameters.
t-statistics from linear regressions on global mean temperature
Single predictors: ln(GDP), t = 6.1
CO2, t = 13.4
CH4, t= 6.3
Double predictors: CO2 t = 4.3, CH4 t = -0.9
CO2 t = 5.5, ln(GDP) t = -1.9
CH4 t = 0.5, ln(GDP) = 0.01
Triple predictors: ln(GDP) t = -3.6, CO2 t = 8.7, CH4 t = 2.8
CO2 has the largest t values throughout and is the best predictor of global mean temperature, as expected, given its thermal characteristics. CO2 also likely has the most reliable ambient measurements, contributing to its statistical success.
Data Sources Natural Gas Gross Withdrawals and Production US Energy Information Administration
Synthesis Report Of The IPCC Sixth Assessment Intergovernmental Panel on Climate Change