
Wastewater Epidemiology (WWE)
“SARS-CoV-2 RNA concentration in wastewater successfully tracks regional infection dynamics and provides less biased abundance estimates than clinical testing.”
– Robert Knight, Professor, Pediatrics, Computer Science and Engineering, UC San Diego
Surveillance of viral loads in community wastewater began early in the pandemic in Europe, somewhat predictably followed by concerns about infections in aquatic habitats. We previously reported on predicting COVID caseloads from wastewater concentrations; the technology now includes sequencing to identify specific COVID variants. The CDC established a dashboard for reporting nationwide of WWE surveillance data along with COVID-19 caseloads and hospitalizations that form the basis of our analysis.
We chose national data on hospital admissions as the clinical measure of interest because they are considered more reliable than cases. Our outcome metric is the rate of hospitalization per unit of COVID in wastewater at a given time. Viral shedding by an infected individual may be a marker of infection. The relationship between hospitalizations and wastewater concentrations may indicate the severity of infection and contrast individual outcomes with community-wide indicators.
 Data
Data
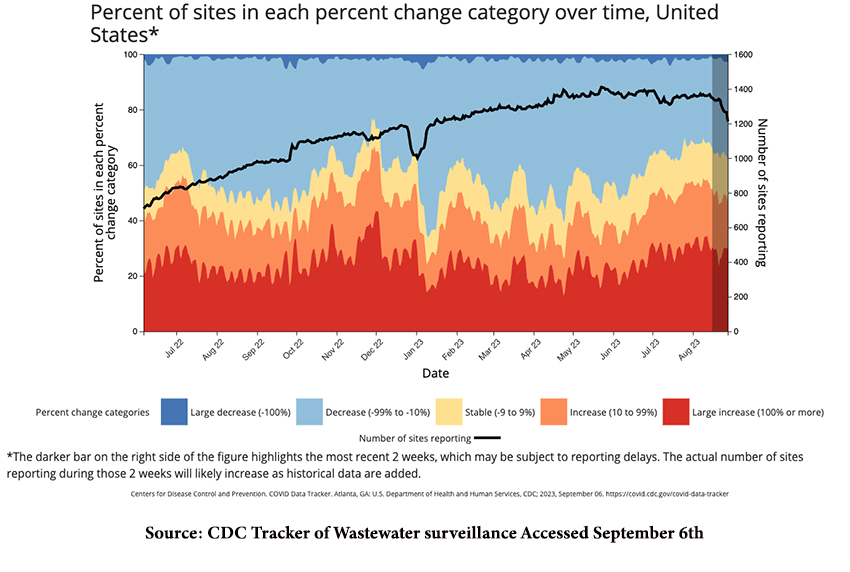
Virus concentrations are measured as “copies” per liter, often in trillions, and may be sensitive to wastewater flow rate and other surveillance characteristics. CDC only reports weekly changes among the reporting sites, since January 2022.
We constructed weighted averages of the CDC’s five categories of change (shown in their graphic above) to represent the entire output of a week’s sampling in terms of a single parameter. We compared changes in admission rates with changes in weighted-average water samples, recognizing that hospitalization may lag wastewater contamination. Our analysis considered only percentage change, not absolute values. A positive change signified more infections, a negative change, fewer.
Prior peer-reviewed studies have demonstrated that wastewater surveillance can “improve the accurate assessment of community SARS-CoV-2 infection prevalence” and “provide early warning for healthcare systems.” A Swedish wastewater study showed a 2.7-fold increase in COVID cases for a 5-fold increase in the COVID viral load.
Our Findings
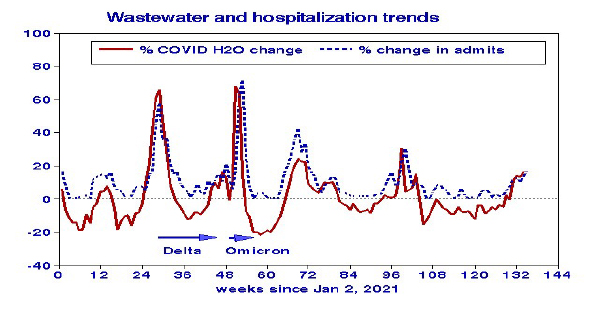 The history of COVID hospital admissions since January 2021 closely follows that of wastewater surveillance, with no consistent lag relationship.[1] The major peaks in both parameters correspond with Delta and Omicron variants. The most recent data, August 2023, show closely linked increasing trends, albeit at much lower levels than previously experienced. The highest admission rates corresponded to
 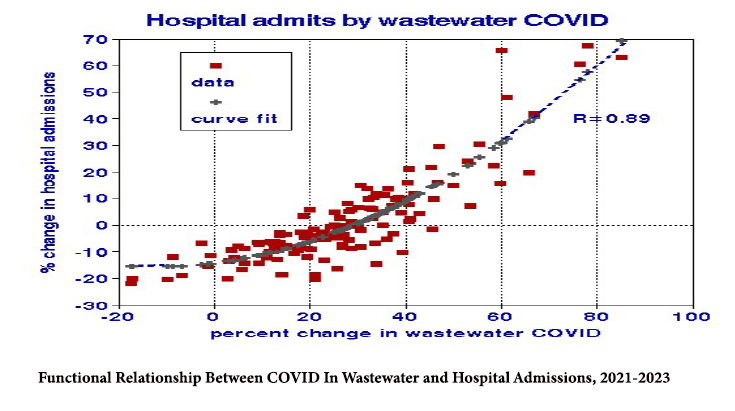 the presence of the Delta and Omicron variants. We found a precise nonlinear relationship between the change in wastewater COVID-19 and hospitalization with a slope of about 1:1 at the higher concentration levels.
Discussion
Our analysis comprised the largest population and most recent data (through August 2023). WWE has been touted as a predictor of future hospital loads. It has the advantage of integration over broad catchment areas and facilitating detailed biochemical analysis of stored samples,
thus providing improved population exposure estimates. Hospitalizations should be more accurate than cases in identifying COVID’s prevalence if infectivity remains relatively constant. Combining the two datasets produced the most precise dose-response relationship we have yet developed in our various COVID analyses. However, there are limitations:
- Viral shedding can persist after infection and raise questions about the contributions of Long COVID. Vaccination can alter the rates and persistence of virus shedding.
- Since about half of the US population has no centralized wastewater system, we may have (unintentionally) used a biased dataset.
- The apparent admission threshold at about a 15% increase in wastewater COVID may relate to how we weighted changes in the five concentration categories to provide a measure of overall change in COVID contamination. Alternative weighting of the WW COVID measures could produce alternative dose relationships.
- The absence of lag effects reduces the time that a hospital may have to prepare for future increases in patient loads.
“If a reliable relationship with the community recovery from COVID-19 infections can be established, wastewater data might also be feasibly used to indicate when areas are ready to relax restrictive measures….”
- Lance Gable, Professor of Law at Wayne State University Law School
Despite its limitations, WWE can identify populations at risk regardless of their hospital service area or rate of testing and can provide an alternative measure of COVID’s impact. It may play a role in more precisely identifying geographic locations and populations of concern for targeted interventions.
[1] WW correlations with hospitalizations were 0.89 with no lag, 0.78 with a 1-week lag, and 0.58 with a 2-week lag.


