
“Viruses mutate and a new variant (EG.5) has started to spread and has infected more people than any other strain.” Yale Medicine
We utilized CDC data files on hospitalization and mortality rates through 2023 to look for insights into the current situation. We focused on hospitalization and mortality rates because case counts are inaccurate. There is a 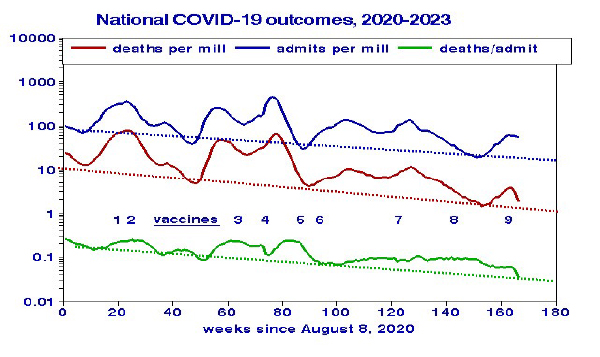 series of peaks and valleys with overall declines of about 30-fold, reaching new lows by summer’s end. Mortality rates hovered at around 10% of admissions. Temporal trends of admissions and deaths are highly correlated (R=0.95), with deaths lagging by one week. Both admissions and deaths declined over time; admissions decreased by 1.05% per week, and deaths by 1.27% weekly. At that rate, COVID-19 deaths might be halved during the coming year.
Conventional wisdom holds that COVID peaks may be attributable to new variants. The numbers within the graph correspond to the timeline of the various vaccinations and booster shot programs. With the introduction of the vaccine (point 2) and the subsequent boosters (point 4 and 7) COVID admissions and deaths declined. Increases in these outcomes are presumed due to new virus variants, especially the Omicron variant at about week 55 (August 2021). The prognosis for the remainder of 2023 remains unclear.
Regional Trends
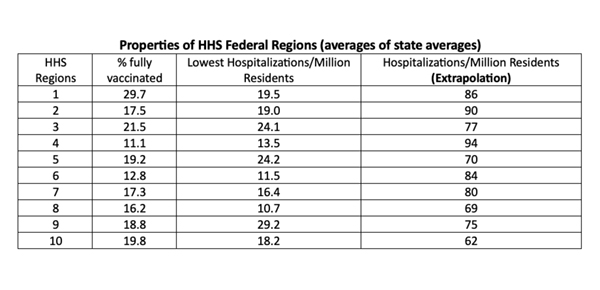 Here we are interested in both spatial (regional) and temporal (trends) effects using data for the 10 regions defined by Health and Human Services (DHHS). The regions differ substantially in terms of COVID vaccination rates, and hospitalizations. The right-hand column shows hospitalization rates extrapolated to Spring 2024.
To highlight regional similarities and differences, we present the 2023 trends as outcomes per million population on a logarithmic scale.
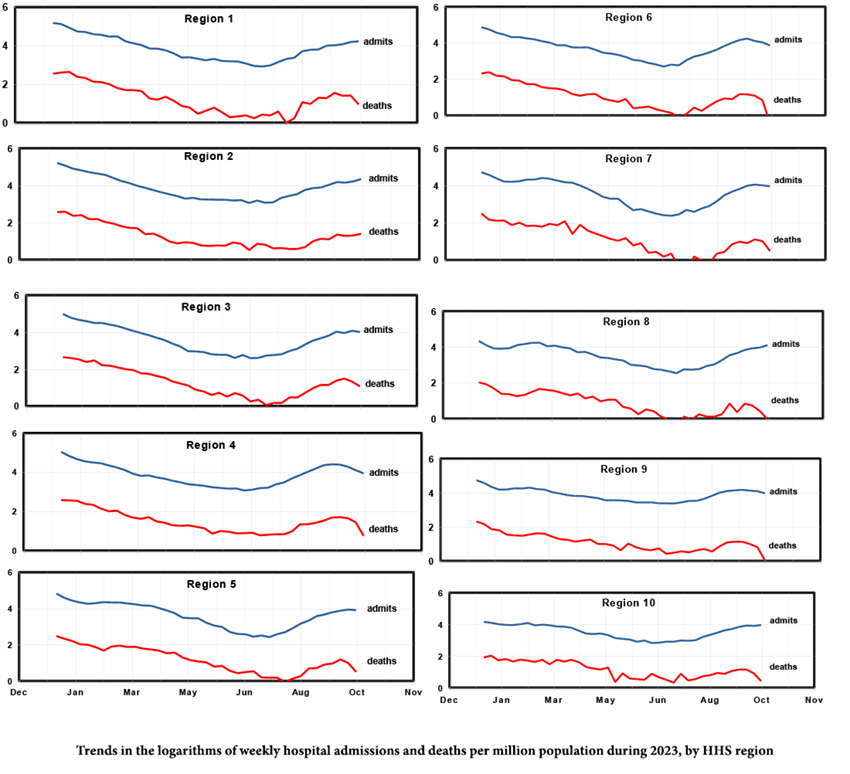
- All regions show declining admissions and deaths during the first 6 months, followed by somewhat steeper rates of increase. Region 7 (Iowa, Kansas, Missouri, and Nebraska) has the steepest rates, Region 9 (Arizona, California, Hawaii, Nevada, and our Pacific Commonwealth Islands) the shallowest.
- Region 4 (Alabama, Florida, Georgia, Kentucky, Mississippi, North Carolina, South Carolina, and Tennessee) has the lowest vaccination rate, the highest at-risk population, and the highest extrapolated hospital admission rate. But Region 1 (Connecticut, Maine, Massachusetts, New Hampshire, Rhode Island, and Vermont) and Region 2 (New Jersey and New York) also have high extrapolated hospital admission rates.
- Subsequent declining rates in Regions 4, 6, and 9 [1] indicate possible peaks in hospital admissions for September.
- Rising rates in Regions 1, 2, and 8 [2] suggest increasing hospitalizations throughout the fall.
Given this diversity in recent trends among regions, projections to the future remain problematic.
Using linear regressions across the 10 regions, we found no relationships linking differences in COVID-19 outcomes with differences in either original or boosted vaccination rates. This was also true at the state level.
[1] These regions include Alabama, Florida, Georgia, Kentucky, Mississippi, North Carolina, South Carolina, Tennessee, Arkansas, Louisiana, New Mexico, Oklahoma, Texas, Arizona, California, Hawaii, Nevada and our Pacific Commonwealth Islands.
[2] These regions include Connecticut, Maine, Massachusetts, New Hampshire, Rhode Island, Vermont, New Jersey, New York, Puerto Rico, the Virgin Islands, Colorado, Montana, North Dakota, South Dakota, Utah, and Wyoming.


