Blood glucose is regulated by a network of organs inter-connected by nerves and chemical mediators some that we have identified, others we have not. Despite our increasing knowledge and belief that blood sugar is a dynamic response across a complex network, diagnostically we continue to rely on fasting blood sugars, a response to a glucose load or hemoglobin A1C.
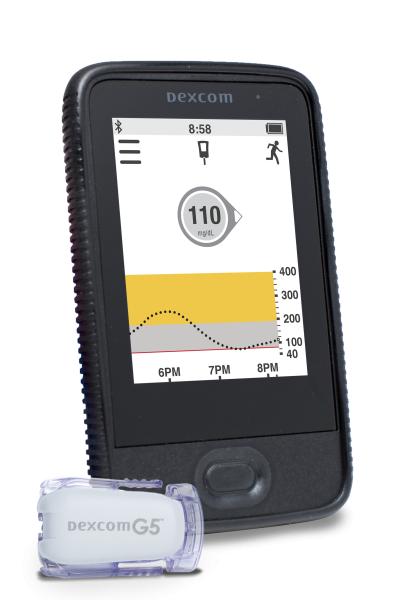
The increasing incidence of diabetes has focused our attention on the “run-up” to a formal diagnosis, something that is termed pre-diabetes. The conceptualization of this “sub-clinical” dysregulation of glucose metabolism suggests that diabetes falls on some form of linear spectrum. While this is a conceptual improvement, it still does not incorporate the dynamics of a network of interactions. The requirement that glucose is measured by finger or needlestick underlies our reliance on static, infrequent sampling and provides us solely with snapshots. The development of patient-friendly, minimally invasive, continuous glucose monitors (CGM) removes this limitation. Earlier this year, the FDA approved the first CGM system for clinical use; another was approved last week. These devices, worn every day, providing warnings of too high or too low a blood sugar to users through their smartphones are issuing in a new era in both the treatment and diagnosis of diabetes. This is a big deal.
A newly published study in PLoS Biology presents data suggests that CGM testing may alter our understanding of glucose’s regulatory network and our reliance on the current diagnostic tests for diabetes. This was a small study, 57 healthy individuals between ages 25 to 76 without a prior diagnosis of diabetes.
The participants wore a CGM that measured glucose levels every 2 minutes for 2 to 4 weeks, and the patterns of blood glucose were subsequently analyzed. The researchers identified three patterns of variability in those glucose measurements. Some individuals maintained their blood glucose within a ‘narrow’ range, showing little variation over the course of the day, others demonstrated much more variation, with spikes to high values.
The traditional diagnostic tests for diabetes identifies glucose dysregulation in three ways. An elevated fasting blood sugar shows that the glucose “set-point” is too high, outside the normal range. An elevated HgA1c, indicates elevated glucose levels in the past, that the dysregulation is chronic. An oral glucose tolerance test (OGTT) is a rough measure of how we respond to an oral glucose load. It is limited in its functionality because it only measures blood glucose at two points in time after we drink the 75 gms of syrup. Using these traditional diagnostic tests, five volunteers were diagnosed with diabetes, 14 had findings consistent with pre-diabetes, the remaining 38 were normoglycemic. The fact that five individuals were diabetic by diagnostic criteria but clinically asymptomatic should give us all pause.
As you might expect, variability in blood glucose levels was roughly associated with the traditional diagnostic markers, fasting glucose, HgA1c, and the response to a glucose load. Less variability resulted in more “normalized” values for the diagnostic tests. The same association held for BMI and insulin resistance, patients with little variation in blood glucose were more “normal.” But there were many exceptions to this generalization, both between individuals and within individuals throughout the day. The picture of glucose dysregulation from continuous glucose monitoring is entirely different than the static values; the patterns identified by the researchers did not map exactly to our current diagnostic markers.
Why might this occur?
There are numerous pathways to diabetes, the death of islet cells in Type 1 diabetes, the dysregulation of the same islet cells in Type 2 diabetes are two examples. But if there are other factors, related to diet, activity, time of day, or stress, to mention just a few. Is it possible that many interacting factors contribute to dysregulation, and our current tests only identify when “the straw has broken the camel’s back,” the “end-stage” of glucose dysregulation, diabetes? What if we could identify those at risk earlier? Some individuals with a pattern of severe variability in glucose demonstrated markedly abnormal responses to glucose loads, despite being clinically normoglycemic. Are these patterns of severe variability an earlier sign of glucose dysregulation? And if so, are their preventative measures we can take? Those answers require further research and time; this study opens the door.
From a practical, clinical point of view, another of the study’s findings are relevant. First, several participants were given a defined mixed meal with similar calories but varying amounts of protein, fat, and fiber. The majority of participants demonstrated wide swings in blood glucose to a breakfast of milk and cornflakes (high sugar, low fiber) but there were fewer swings as more fat or protein were added. In fact, 83% had a higher glycemic response to mixed meals than a traditional OGTT’s 75 gms of sugar syrup. With the ability to continuously monitor blood glucose the needle stick constraints of OGTT are eliminated. No one sits down to a meal of 75 gms of glucose; we eat a variety of foods. Is it time to reconsider how we perform this challenge?
The benefit of CGM lies not in providing more data point, but in delivering data points in vivo, during real life not during a visit to the lab. It opens up the possibility of a new understanding of the many factors that contribute to failing glucose regulation and hopefully opens the door to new more timely interventions.
Source: Glucotypes Identify New Glucose Dysregulation Phenotypes PLoS Biology DOI: 10.1371/journal.pbio.2005143


