As of today, the American death toll from COVID-19 stands at more than 69,000, according to Johns Hopkins. Numbers like this tend to dominate headlines, but there are other stories worthy of our attention when trying to make sense of the pandemic, especially when it comes to making public policy. Let's examine some of them now.
1) Infectious disease models have changed again, this time for the worse. The models employed to predict deaths from the coronavirus have been all over the place. Now, for what it's worth, they seem to be converging on something resembling a consensus. According to FiveThirtyEight, the average prediction for six models ranges from 93K to 111K deaths by May 30.
But, as usual, it's difficult to tell how seriously to take these projections. As FiveThirtyEight explains, "COVID-19 models aren’t made to be unquestioned oracles. They’re not trying to tell us one precise future, but rather the range of possibilities given the facts on the ground."
So, what are the facts on the ground? Our World in Data shows that the U.S. had about 1300 deaths from COVID-19 each day since May 3. If we extrapolate that out to May 30, it suggests just over 100,000 deaths by May 30. But we also know that (1) the weather is warming up; (2) a somewhat effective antiviral drug called remdesivir soon will be shipped; and (3) lockdown restrictions are being lifted. The first two facts would suggest a decrease in COVID-19 deaths, while the third would suggest an increase. (Such variables, which are tough to model, can greatly impact projections. Weather forecasts are a lot easier.)
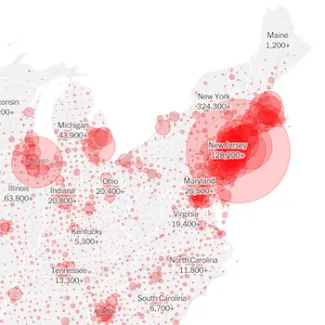
2) COVID-19 is largely a disease of the U.S. East Coast. While Washington (specifically Seattle) was the original hotspot for coronavirus in America, that dubious distinction has decidedly shifted to the U.S. East Coast and to New York City in particular. The map below comes from the New York Times:

The New York Times also breaks down the numbers by each state. When organized by number of cases per 100,000 people, the states hit hardest are mostly in New England or the mid-Atlantic region.
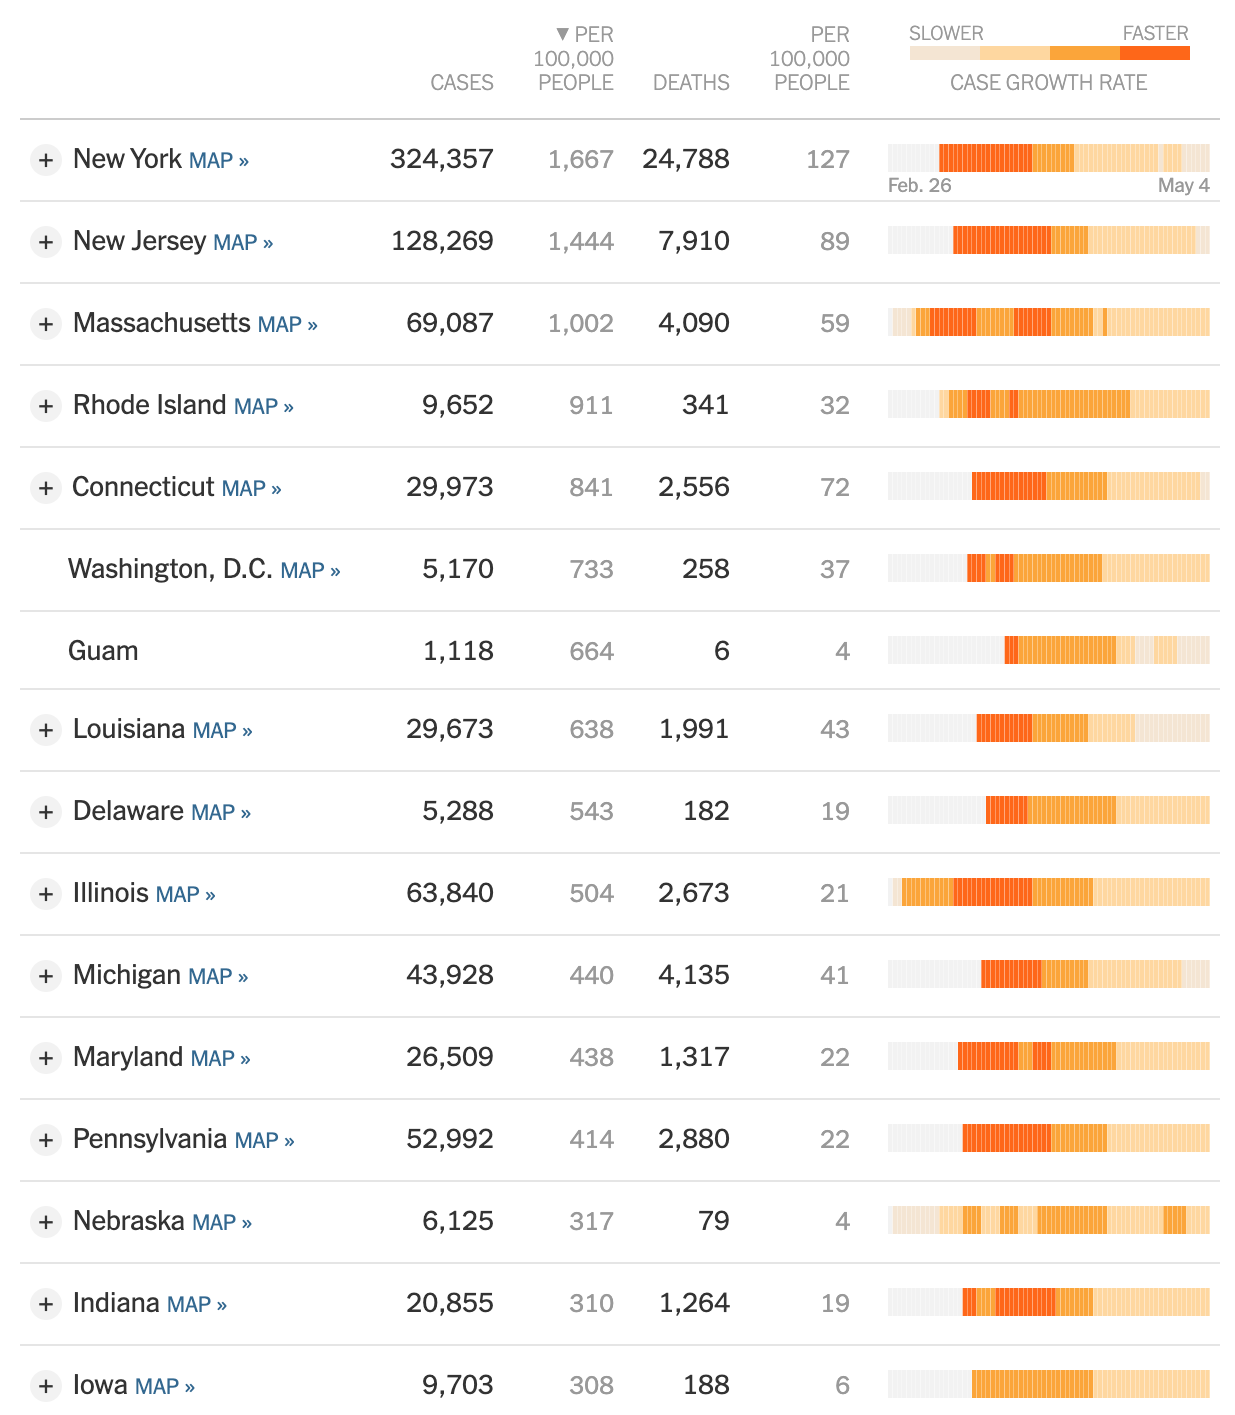
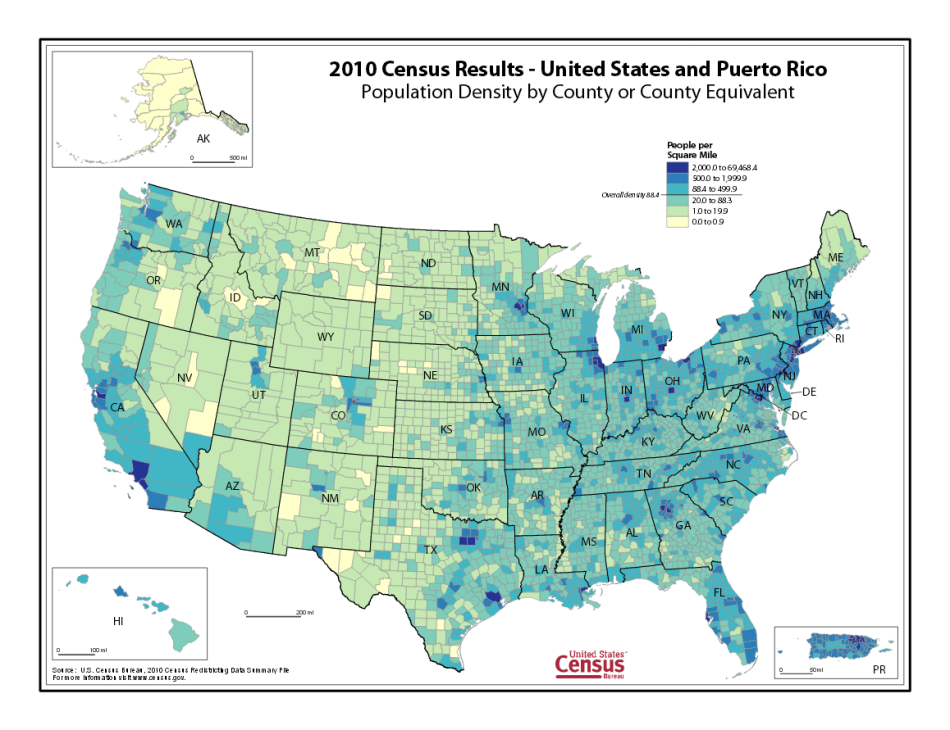
By this measure, the five worst states are New York, New Jersey, Massachusetts, Rhode Island, and Connecticut. Washington, D.C. is #6, if it's treated as its own state. Why would this be the case? Probably because this region is incredibly well-connected in terms of mass transit (as well as international travel) and has a high population density. In fact, a map of population density by the U.S. Census Bureau looks awfully similar to the COVID-19 map above.
3) Municipal and state bankruptcies constitute the next economic crisis that few people are talking about. Right now, the soaring unemployment rate and the massive stimulus spending by the U.S. government are getting all the economic headlines. But there is brewing beneath the surface a tidal wave of bankruptcies that may hit municipal and state governments. When economic activity ceases, government coffers dry up.
No worries, Uncle Sam has it covered, right? Not exactly. As a column in USA Today notes, the federal government didn't bail out states following the Civil War or during the Great Depression.
It's somewhat paradoxical that the most important stories are the least publicized. We'll do our best to draw your attention to them as the pandemic goes on.

Alex Berezow, PhD
Former Vice President of Scientific Communications
Dr. Alex Berezow is a PhD microbiologist, science writer, and public speaker who specializes in the debunking of junk science for the American Council on Science and Health. He is also a member of the USA Today Board of Contributors and a featured speaker for The Insight Bureau. Formerly, he was the founding editor of RealClearScience.


