The Centers for Disease Control and Prevention has released provisional mortality data[1] by cause, age, and race for 2020 that facilitates assessing “excess” mortality. Here I define percent “excess” as the ratio of COVID-19 related deaths to the non-COVID-19 deaths as obtained by subtraction. That figure for the nation was 12.8%, which seems a modest effect but represents nearly the national improvement in mortality over the last twenty years.
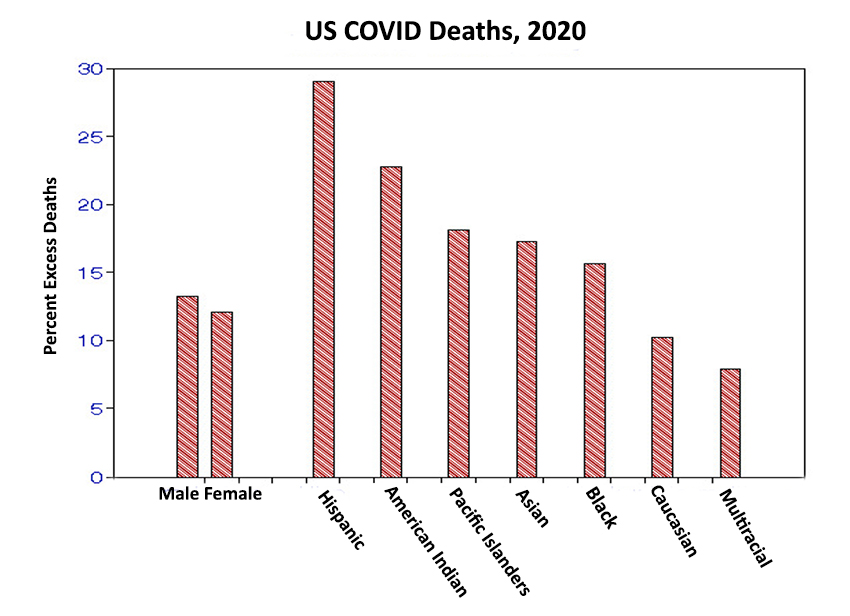
Males exceed females by 10%, and those with Hispanic heritage exceed those declared multi-racial by a factor of 4.
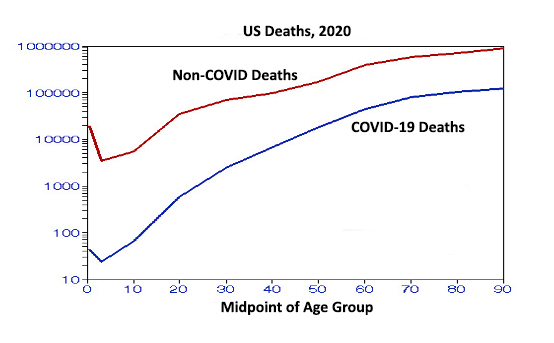
 This figure shows the distributions by age. The mean slopes from age 35 to 65 are statistically significantly higher (steeper) for COVID-19 deaths but both decrease after age 65 for both groups, ostensibly due to the “healthy survivor” effect.
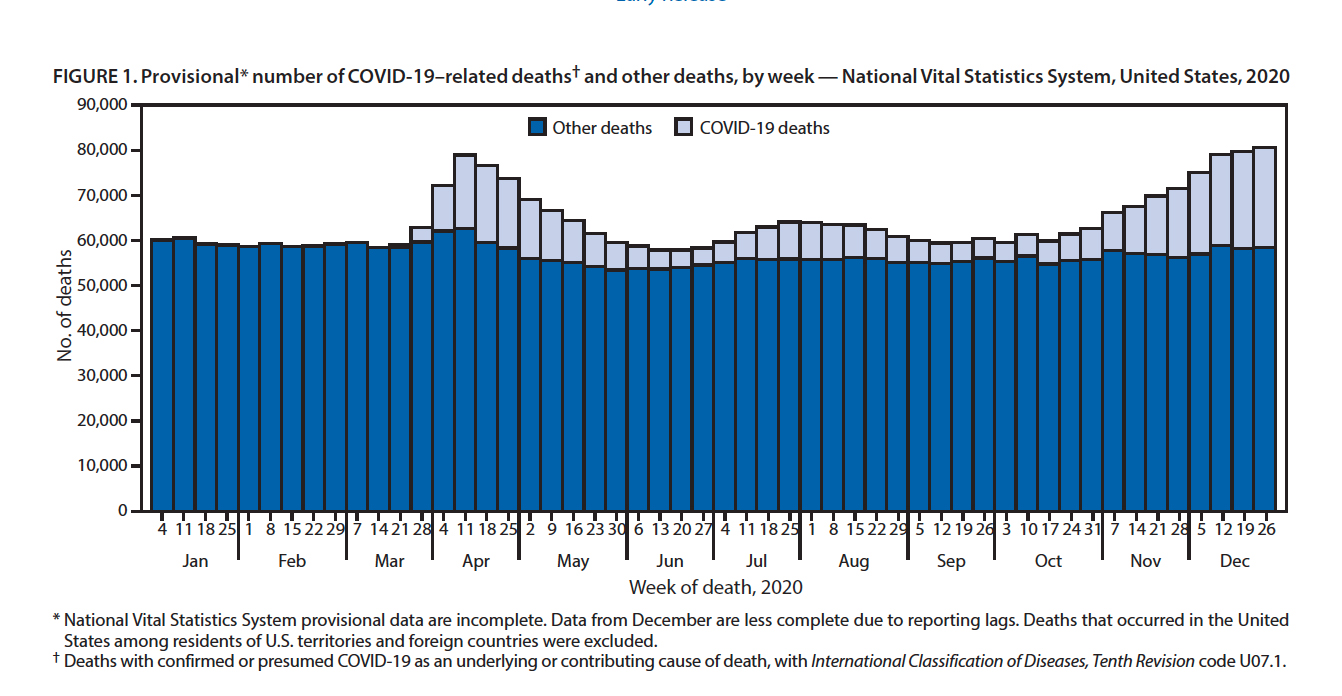
This figure, drawn directly from the CDC report, shows that the excess averaged deaths varied by a factor of six, from 7 to 38%, during the year. The effect was not purely seasonal, with peaks in April and December.

This scatterplot shows the geographic distribution by state [2,3]; data points along the perimeter are labeled for clarity. These are approximations as none of the data has been adjusted for differences in age distributions or race. Some of the racial disparity may be indicated by ranges of COVID-19 mortality/100,000:
- Latino: from 109 in New Hampshire to 448 in New York (factor of 4.1)
- American Indian: from 88 in Ohio to 1466 in Mississippi (factor of 17).
- Asian: from 41 in Oregon to 354 in North Dakota (factor of 8.6)
- Black: from 97 in Oregon to 429 in New York (factor of 4.4)
- Caucasian: from 26 in Vermont to 198 in North Dakota (factor of 7.6)
The high excess percentages at the lowest non-COVID-19 mortality rates suggest possible transfers between cause-of-death categories or the consequences of not adjusting for age.
The overarching message here is one of diversity. For example, pairs of states with similar percentages of COVID-19 deaths: NY-AZ, UT-WV, CA-MS. have few similar characteristics. Previous studies have shown that COVID-19 infections, cases, may be associated with personal exposure factors, e.g., wearing a face mask, household crowding, education, and political affiliation, presumably a marker of personal behavior. COVID-19 deaths, a necessary subset of cases, may be more associated with situational factors beyond individual control, such as race, population density, geography, and or pollution.
Some of these factors can result in significant effects, for example, the multifold variations in deaths categorized by race. These risk factors dwarf those found in most epidemiology studies (such as the air pollution studies with which I’m most familiar where mortality risks are of the order of 10%) and resemble those for smoking (factor of 2). I would conclude that the diversity seen above in terms of demography, time, and place must be due to combinations of those and still undiscovered risk factors.
[1] Provisional Mortality Data — United States, 2020 CDC "Morbidity and Mortality Weekly Report" March 31, 2021.
[2] National Vital Statistics Reports, Vol. 69. No. 13. January 12, 2021.
[3] https:/www.statistica.com/statistics/1109011/coronavirus-covid19/death-rates-us...


