Previously we showed that COVID-19 cases trended sharply downward following increased rates of vaccination. Today we explore the sources of the variability we identified in our national regions.
Methods
We used regression analysis to estimate relationships between cumulative vaccination rates and selected predictor variables reflecting people and places. [1]
- People: age, race, ethnicity, politics, face-mask usage, education, income.
- Places: population and residential density, geography, ambient air quality.
They essentially represent people vs. places but are of varying quality. We used multiple regressions to distinguish their separate effects, recognizing that such relationships may not be linear.
Results
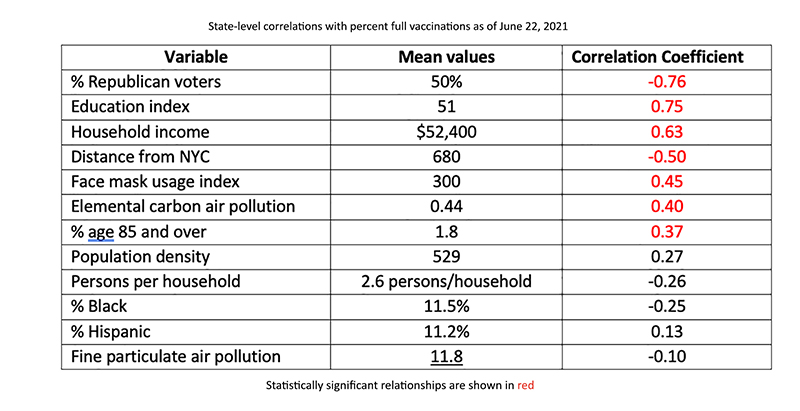
Neither person nor place is predominant, although some personal characteristics are clearly more important than the environmental or situational “place factors.” We investigated the top three, voting-education-income, in more detail. Household income was the least important, voting as a Republican the most significant in our multivariate model [2] with an overall correlation coefficient of 0.87 and a mean prediction error of 10%. The performance of this model is much better than those from typical epidemiology analyses.
 These interactions are depicted graphically and illustrate the interplay between the nonlinear negative effects of the fraction of Republican voters and the positive daily effects of education. The total effect of education (maximum – minimum) is about 24 percentage points, while the political impact is about 46
 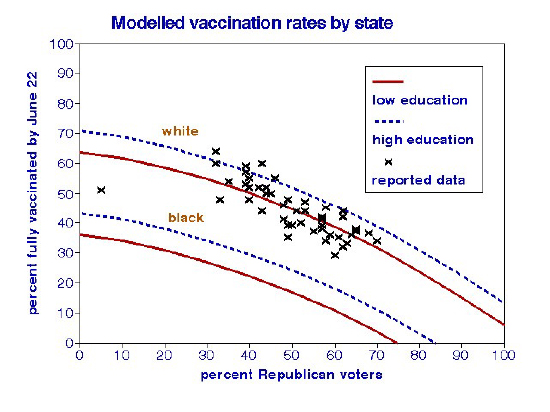 points, similar to the overall mean percentage of complete vaccinations (44% of the population).
However, the curve reflecting Republican voters is quite sensitive – without vaccination data from the District of Columbia (DC), the political relationship would be linear, steeper, and indicate about an 80% vaccination rate for a Democrat and 10% for a Republican. The political relationship is essentially nil for states with fewer than about 40% Republican voters in the 2020 national election. Recent reports indicate that in-person voting may have facilitated COVID-19’s spread and that Republicans were more likely to vote in person, supporting our state-level findings.
Conclusions
We conclude that the diversity among state-level rates of COVID-19 vaccinations relates to personal characteristics. Immutable factors like population density or ambient air quality are less likely to be important.
[1] Data were taken from multiple sources, and its overall quality varied. For example, face-mask usage data were from a survey last summer, and population density data are for the entire state rather than residential communities.
[2] For the mathematically inclined:
% fully vaccinated = 41 + 0.15 Republican Voting – 0.007 Republican Voting 2 + 0.24 Educational Index


