
Methods and Data. We assembled multiple datasets.
- Two geographic datasets - the 48 conterminous states with the District of Columbia (“states”); and 100 of the largest US counties, each of which includes a major city (“counties”).
- COVID-19 infections (“cases”) and completed vaccinations. [1] [2]
- Political data from the 2020 national election.
- A CDC survey of vaccination coverage and cumulative COVID infections among 40,212 health care workers in 300 long-term care – stratified by job category [3]
Findings. Statistics of the datasets are summarized below. Cases were analyzed in terms of the logarithms of cases per million population. The table compares mean or median and range (minimum-maximum) values. We used linear regressions to estimate relationships between cases per million and independent variables. The percentages of complete vaccinations were the best predictors of new cases in either states or counties or health care workers [4].
Those results were used to estimate the reduction in cases that would be realized if herd immunity (70% fully vaccinated) could be achieved.
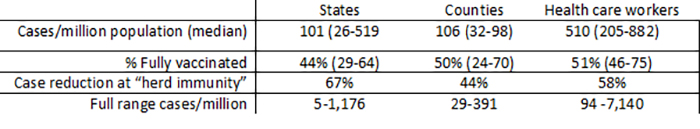
The CDC [3] was unable to control for confounding in their analysis because of the lack of appropriate data on individuals - this is not a problem with our data aggregated by state or county. We conducted a limited confounding investigation and found no impact of ethnicity, political persuasion, or gross domestic product (GDP) at the state or county level. However, although politics did not confound vaccination status in the states, voting Republican essentially canceled the benefits of vaccination. The three estimates are not significantly different. Based on those regressions, the “full range” values are estimated for zero and 100% full vaccinations. 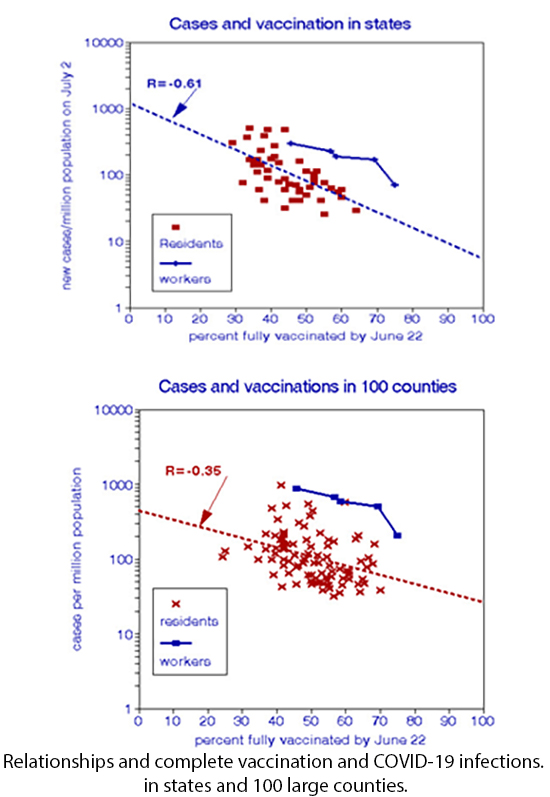
The substantial differences among the full range values that contrast full and zero vaccinations stem from using a logarithmic scale, as shown in Figure 1, which also indicates the higher risks borne by the health care workers. However, the slopes of the three regressions are not statistically different and demonstrate a median vaccination efficacy of 98.5%. For comparison, CDC recently published data from 13 states on the effectiveness of several vaccines in preventing elderly hospitalization through April 2021 [5]. They ranged from 84% for the Moderna vaccine to 96% for Pfizer-BioNTech.
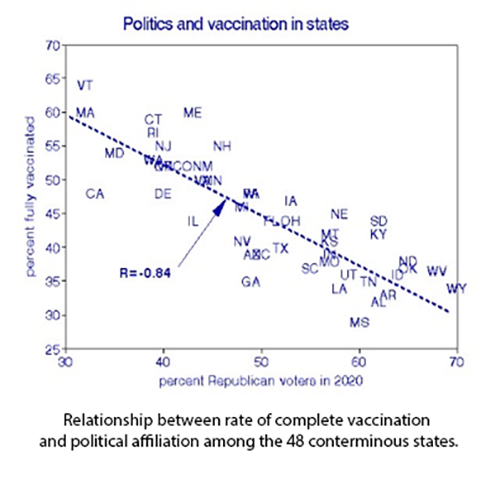
Figure 2 shows the relationship between political persuasion and vaccination rates in the 48 conterminous states. [6] This is probably the most robust bivariate relationship we have seen in our COVID-19 analyses and is nearly -1:1. However, it should not be interpreted as indicating that voting Republican creates COVID infection; more likely, it shows a tendency for more viral exposure by not practicing avoidance procedures, i.e., masks and social distancing.
 We conclude that the real-world evidence for vaccination limiting COVID-19 infections is strong, having been similar in three different settings. The resulting estimate of vaccine efficacy comports with clinical findings. Being vaccinated and political affiliation accounted for 70% of the observed variation in daily infection rates.
[1] Data can be found here.
[2] Becker’s Hospital Review Vaccination Data
[3] MMW, Vol 70, No. 30, July 30, 2021.
[4] Timing of cases in relationship to vaccination for the health care workers was not reported.
[5] MMWR Vol 70, August 6, 2021.
[6] The District of Columbia is an outlier (5% Republican voters) and is not included here.