
No One Is Safe Until Everyone Is Safe
The figure to the left shows the distributions of completed vaccinations as of July 2021 for 100 large US counties, US states, and selected foreign countries [1]. We paired the counties to compare their distribution with states (n=50). [2]. As expected, the county data are more variable than the states, but there is no evidence  of hot spot concentrations or randomness. The range from the least to the most vaccinated is 30-40 percentage points. The three data sets show comparable maximum vaccination rates. At the current rate, about three months would be required for the US to reach “herd immunity” (about 70%).
The US is doing relatively well on the international scale. The range in vaccinations internationally is much greater, about 70 percentage points. The low and, to a lesser extent, middle-income countries have negligible vaccinations. International differences correlate with economic factors such as gross national product (GNP), a comparative measure of resources, and the capability to obtain and distribute adequate vaccines supplies.  Countries with the highest vaccination rates include Chile, Israel, and Malta. We saw no trend towards higher rates in countries with more authoritarian governments.
Herd Immunity. We used the US state-level vaccination data to illustrate progress toward herd immunity. Our underlying hypothesis is that as time progressed:
- Vaccines became more readily available.
- The more anxious were vaccinated first in all regions
- The fractions of the remaining recalcitrant and uncertain varied by region
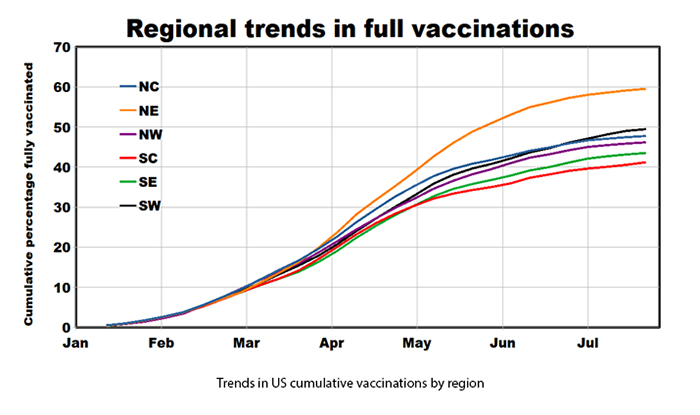 Media surveys estimated this last group at about 30%, consistent with this graphic.
Predictors of US Vaccination Rates. Several factors may contribute to regional variability in the US, including race, ethnicity, and socioeconomic status. We found that political persuasion was among the strongest. It remains to be seen if this trend persists as the national mood changes.
Conclusions. US vaccination rates rank high on the international scale but achieving herd immunity may be problematic, especially in the US, given the continuing decrease in daily rates. Unfortunately, changes in the controlling factors, politics at home and economics abroad, are likely to remain elusive. For the sake of the common good, rich countries should provide more assistance to the poor, and the US should continue to educate the “uncertain.”
[1] https://www.nytimes.com/interactive/2021/us/covid-cases.html
[2] Notes on Graphics - The first graphic compares the distributions of the three datasets based on their rank orders, smallest to largest vaccination rates. We found this presentation to be clearer than the standard bell-shaped distribution curves. To use a common x-axis (1 to 50 in this case) for the three datasets, we concatenated the 100 counties into 50 pairs by averaging the vaccination rates for successive counties.
In the second graphic, the close spacing of the data points precluded labeling each country, especially given the lack of universal abbreviations. Instead, we chose to label the extremes and selected central points to indicate relative importance. Since this is a log-log plot, the 1:1 line indicates where a given percentage in GNP is equivalent to the same percentage in vaccination rate.