
COVID infections may result in
- Severe symptoms requiring hospitalization (5% of daily cases).
- Complete recovery within several weeks (85%).
- Persistent (“long COVID”) symptoms over months (7.5%).
- Death (0.63%).
These outcomes vary widely globally and nationally and are difficult to predict. Here we focus on case and death rates in the context of vaccination rates in 99 US urban counties during 2021 and 2022. The “confusion” arises from errors and gaps in the available data and incomplete knowledge of the vaccine’s waning effectiveness.
“Studies show that optimal vaccination strategies are highly dependent on vaccine availability, coverage, effectiveness, and risk factors for infection and severity.” – Lancet Public Health
We used monthly average cumulative COVID-19 data from the 99 previously investigated counties, totaling 131 million people.
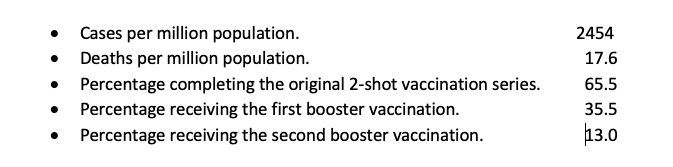
The dataset contains missing entries and apparent outliers and affords six combinations of outcomes as a function of vaccination coverage. For simplicity, we focused on case-fatality ratios (CFRs = deaths/cases) in relation to the total percentage of vaccinations over time.
 We assume that individual death, hospitalization, and vaccination counts are accurate since they tend to be recorded individually, but less so for cases. Under-reporting of cases is likely, for example, due to testing and treatment at home. However, CDC data indicate that such under-reporting is unlikely to exceed 15%. Deaths are much more likely to be correctly counted. Cumulative data tend to be much more stable than weekly averages.
We accounted for differences among the counties by dividing reported outcome rates by the population in millions; we did not use population weighting. We used linear regressions to estimate relationships between vaccine usage and COVID-19 outcomes for various groups:
- Overall averages as functions of time over 25 months.
- Cumulative totals among 99 counties on successive dates.
Finding similar estimates bolsters the overall credibility of our analysis
Typical clinically-based studies have been based on cohorts of individuals, some vaccinated, others not. Vaccine effectiveness is based on differences in COVID-19 outcomes during specified periods. Such cohort studies are necessarily limited in the number of individuals and the study interval but allow detailed consideration of each individual to control for confounding. Vaccinated and unvaccinated Individuals are likely to differ in other ways, such as the likelihood of virus exposure and co-morbidity. We investigated some of those factors separately using state-level data. [2]
Temporal Relationships
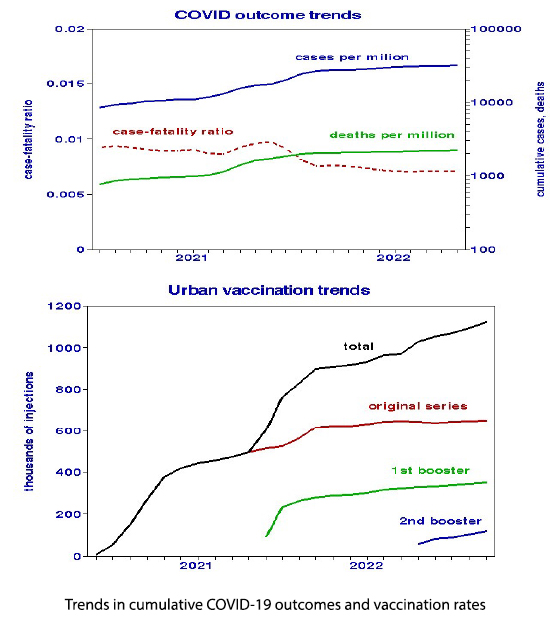
Cumulative cases and deaths increased monotonically, with maximum incremental rates near the end of 2021. Vaccination trends also show perturbations in early 2022, shown here as counts. Sums of the three vaccination programs (“total”) indicate uniform rates of change over the entire period. Trends in the original and first booster programs are quite parallel, with a correlation of 0.90.
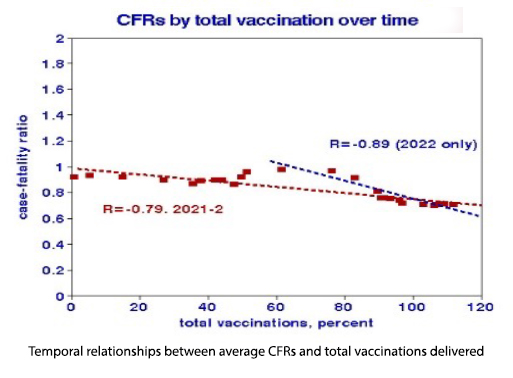 Temporal relationships between CFRs (shown as percentages) and total vaccinations also show discontinuity at the beginning of 2022. Both data sets show significant improvements in CFRs over time, but the vaccination effect is essentially null during 2021. The decreasing CFRs suggest a reduced lethality of the Omicron virus variant after vaccination.
Linear regressions by month allow estimates of vaccine effectiveness. Our population-based effectiveness is about 40%.
Cross-County Relationships
We estimated relationships between CFRs and total vaccinations for each month of 2021 and 2022, which varied substantially. The August plot is typical for the summer of 2022; 4 outliers are indicated (circled), but the regressions were statistically significant with or without those four counties. The individual vaccine benefit was about 50%, similar to the temporal relationship.

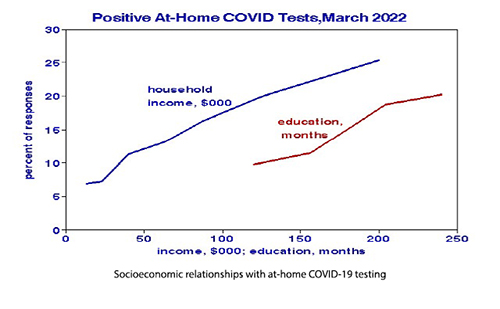
Cross-country relationships include many other ways counties differ systematically from one another independent of timing and thus may be confounded. We used state-level data to illustrate some of them. Political affiliation has the closest relationship with vaccination; more Republicans remained unvaccinated while 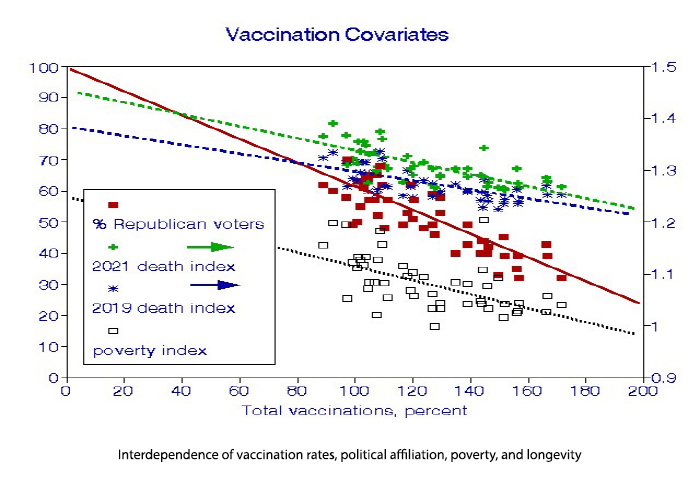 Democrats took all the available doses. The poverty index fits the data less well but shows that the least well-off tend to be the least vaccinated. The “death index” variable is based on the inverse of life expectancy; low index values lived longer, indicating that the most vaccinated individuals were generally in better health. Note that overall death rates increased from 2019 during the pandemic, however, slightly. The regression lines are not parallel, indicating that vaccination may have reduced the COVID “death penalty.” Since our analysis was confined to urban counties, population density would be less critical.

We examined temporal relationships in the average CFRs across the 99 counties and the cross-sectional relationship among the 99 counties at a specific time. We replicated the latter regression for each of the months of 2021-2 and plotted the CFR intercepts, and estimated full vaccination CFRs as a space-time analysis. CFRs with no vaccinations were essentially constant over time.
Discussion
We set out to determine how relationships between COVID outcomes and vaccination rates may have changed over time during the pandemic. To bolster statistical power, we used counties, the smallest national unit having the required data using urban counties to reduce confounding by rurality or population density. We found systematic variations but were less successful in pinning down the reasons. Waning of vaccine effectiveness is a possible rationale.
Our statistical analysis failed to find vaccination benefits during 2021. The effectiveness of a vaccine depends on its composition, the viral characteristics in time and place, and the time elapsed since injection. The original series vaccination program was of little utility in 2021. Still, it is important to realize that low correlation and, therefore, wide confidence limits do not imply that a relationship does not exist but that our analysis was unable to find it. The confounding of other differences in counties beyond vaccination rates may have played a role.
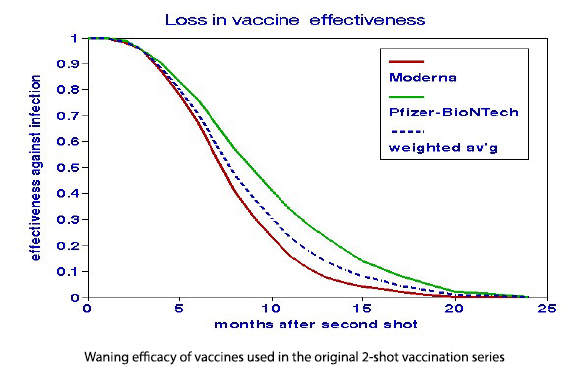 The question of timing is also important. The original vaccination series began to lose its punch after a few months and was effectively useless after a year, hence the need for booster programs. Our vaccine data reflects the distribution of doses and not their actual immunization benefits, which always be less. Our use of the sums of initial and booster doses to predict outcomes may have underestimated the potency of the remaining vaccines. To achieve 100% effectiveness might have required doubling the dosage, all else being equal. Since most of the relatively brief clinical studies of vaccine effectiveness specified dose timing, they effectively overestimated the longer-term benefits to populations.
Our findings uncovered found both expected and unexpected relationships.
Expected
- Vaccination rates cannot explain the significant surges in cases and deaths.
- Vaccination rate was a significant predictor of reduced CFRs in 2022.
Unexpected
- There was no apparent advantage in studying the 99 urban counties rather than 49 states.
- Vaccination rate was not a significant predictor of COVID-19 CFRs in 2021.
- The CFR benefit of vaccination was only about 50%.
We also conclude that the long-term persistence of an immune response is just as important as the degree of short-term immunization and that short-term cohort studies of effectiveness may have been optimistic. Given the difficulty in forecasting vaccine persistence, public health would be better served by promoting booster programs sooner rather than later.
“As newer, more infectious and transmissible variants of the virus emerged, the original 2-dose regimen of the COVID-19 vaccine as recommended in December 2020 was no longer associated with lower rates of adverse COVID-19 outcomes.” - JAMA Network Open
[1] We used the regression results to estimate vaccine effectiveness and compare them with clinical studies.
Outcome = intercept + slope*vaccination rate
The regression intercept estimates outcomes for unvaccinated populations. Outcomes for vaccinated populations are calculated by adding the product of the slope and 100%. Effectiveness is given by the ratio of vaccinated to unvaccinated outcomes.


