A Two-Month Cycle Experts Can’t Explain
A mysterious pattern suggests that the U.S. Delta wave could be starting to ebb.
New York Times, September 1, 2021
Progression Over Time. Here are the regional trends in daily COVID-19 deaths, cases and case fatality rates (CFRs) over the entire pandemic [1]. CFRs are based on deaths lagging cases by a month.
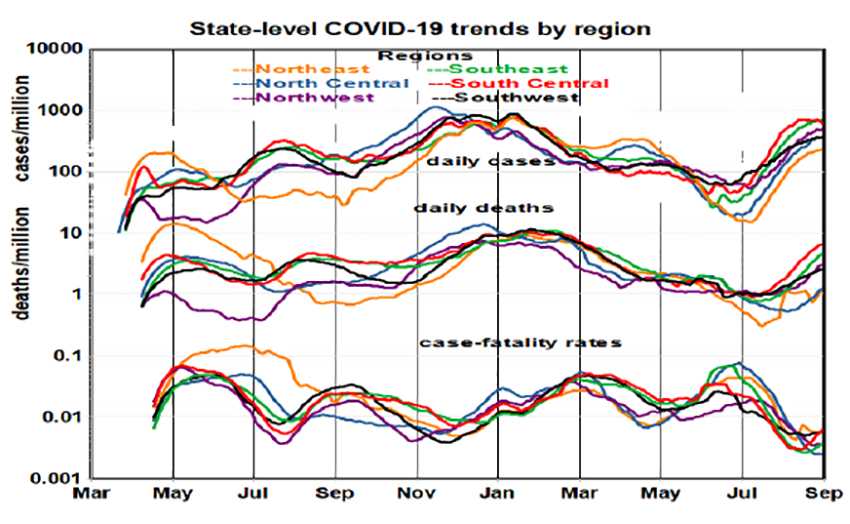
- Both regional and cyclical variations are substantial
- There are 4-5 month cycles in cases: April-August, August-December 2020; January-May, May-September 2021.
- Each cycle has a different “cause,” the initial surge, a winter peak from more frequent indoor activities, reductions as vaccinations took hold, and a sharp increase as the Delta variant spread.
- Initially regional variation in cases was substantial but become more homogeneous after January.
- Case rates tend to peak as the supply of susceptible individuals is diminished.
- Case rates ranged over nearly 2 orders of magnitude, slightly less for deaths.
- CFRs dropped by an order of magnitude between July and September,
Limiting the analysis to 2021 clearly shows the benefits of vaccination (January – July) followed by increasing infection rates that also vary by region, likely due to spreading of the Delta variant.

- Regional variations increased substantially in summer for all three metrics.
- The lag between deaths and cases is most apparent in March-April and July-August.
- The Delta variant arrived in May spreading to all 50 states by July. The pace of increasing infection rates in July and August is the largest seen during the entire pandemic but now appear to be leveling off in the Northeast, Southwest, and South-Central regions.
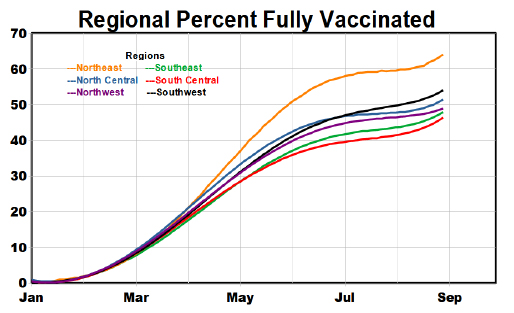
- As of September 1, 52.4% of the U.S. population had been vaccinated, ranging from 38% in Mississippi to 68% in Vermont.
- The progression towards full vaccination ticked upward in August. The largest regional differences, about 18%, are between Northeast and South-Central regions.
- Northeast vaccination rates increased the fastest.
- We are unlikely to achieve herd immunity (70%) any time soon.
What do State-level metrics tell us?
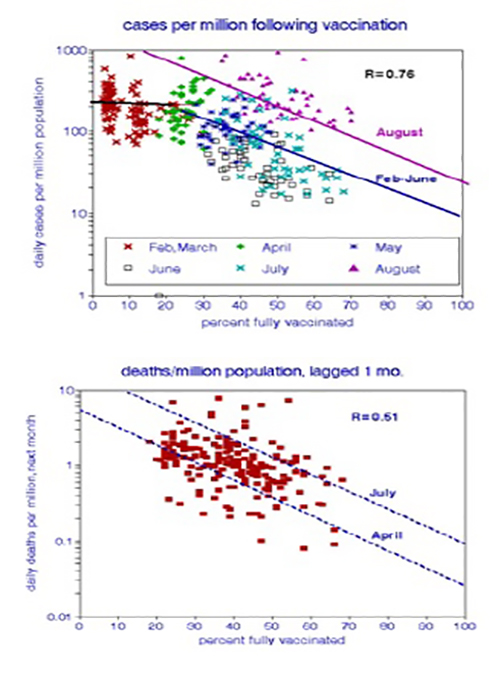
- Case rates decreased with vaccination rate starting in May.
- The Delta variant did not reduce the efficacy of vaccination in case reduction.
- Alabama, Arkansas, Florida, Louisiana. And Mississippi had the highest case rates.
- These trends were highly statistically significant.
- Death rates are more variable than cases, in part because of low counts in small states.
- They ranged over 2 orders of magnitude during this period.
- With vaccination, death and case rates both declined at about the same rate. The Delta variant did not change these trends.
- Deaths also decreased over time. They also increased over time.
- Arkansas, Florida, Louisiana, Michigan, and Nevada had the highest death rates.
- These trends were highly statistically significant.
These figures present a comprehensive but discouraging picture of COVID-19 in the United States. New infections depend on rates of vaccination that are now only about 45-65%. If herd immunity vaccination level (70%) were achieved, the national daily case rate could drop by 5-fold to 33,000 per day.
We’ve been looking at a contest between the quick variant spread and the slowly increasing vaccine acceptance.
[1] Data source NY Times A COVID-19 case is defined as a positive test result; deaths are defined by death certificates.


