
Trends
Coronavirus trends reflect the persistence of the Delta variant through 2021, followed by emergence of the Omicron variant in January 2022. Protection offered by masking and social distancing appeared problematic, as did acceptance of the vaccination programs that began in 2021. Rates increased substantially after mid-2021 and into winter when the Omicron variant became prevalent. Infection rates surged in late 2021, exceeding previous peak levels, and then subsided with no overall trend, while death rates and CFRs decreased significantly. Coverage by the original vaccine program leveled off, and the first booster program got underway.
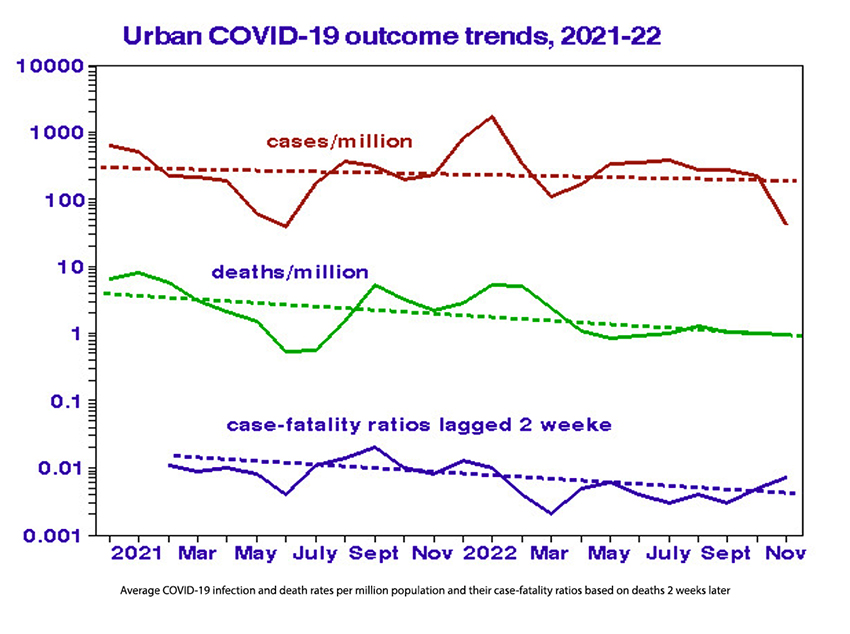 Urban death rates have now leveled off at about one death per million population per day or about 120,000 per year for the nation, and the probability of death two weeks after infection is down to about 0.4%.
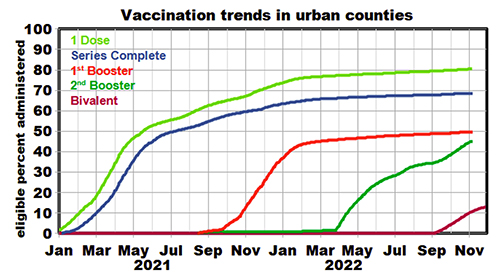 Trends in urban vaccination coverage are shown in the graph, in which booster coverage is expressed as a percent of those eligible, defined as recipients of the 2-shot original series. Rates of increase are similar in all vaccination programs. The first booster followed the original series by about seven months, the second booster after about five months, and the third after about four months. These vaccination rates have decreased substantially over time, and the overall trend is decreasing coverage.
We see no consistent relationship between COVID case trends, deaths, and vaccination coverage. Cases and deaths decreased in early 2021 as the original vaccination program took hold, only to reach new peaks at year-end as the booster programs began. During the remainder of 2022, case rates decreased while vaccination coverage increased, but death rates held steady. Limiting the analysis to urban counties has not been as clarifying as we had hoped.
Diversity Among Counties
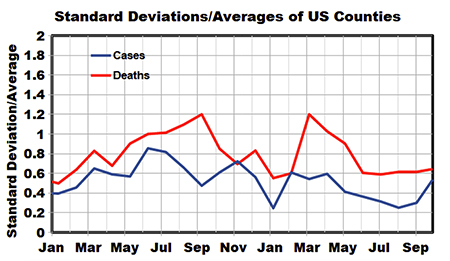 We considered each county an independent observation regardless of its population density; population weighting was not considered. The standard deviations of the case and death rates among the 99 counties are measures of their diversity; their variability over time is displayed in terms of +ratios to the corresponding mean values. We see that these measures are quite variable over time. In January 2022, the ratio of standard deviation to mean was about 0.25, and the average case rate was about 1000 per million. In June 2021, there were only about 50 cases per million, but the ratio increased to 0.85. Thus, the low infection rates were substantially more diverse among the 99 counties than peak rates. As expected, death rates were twice as variable as case rates.
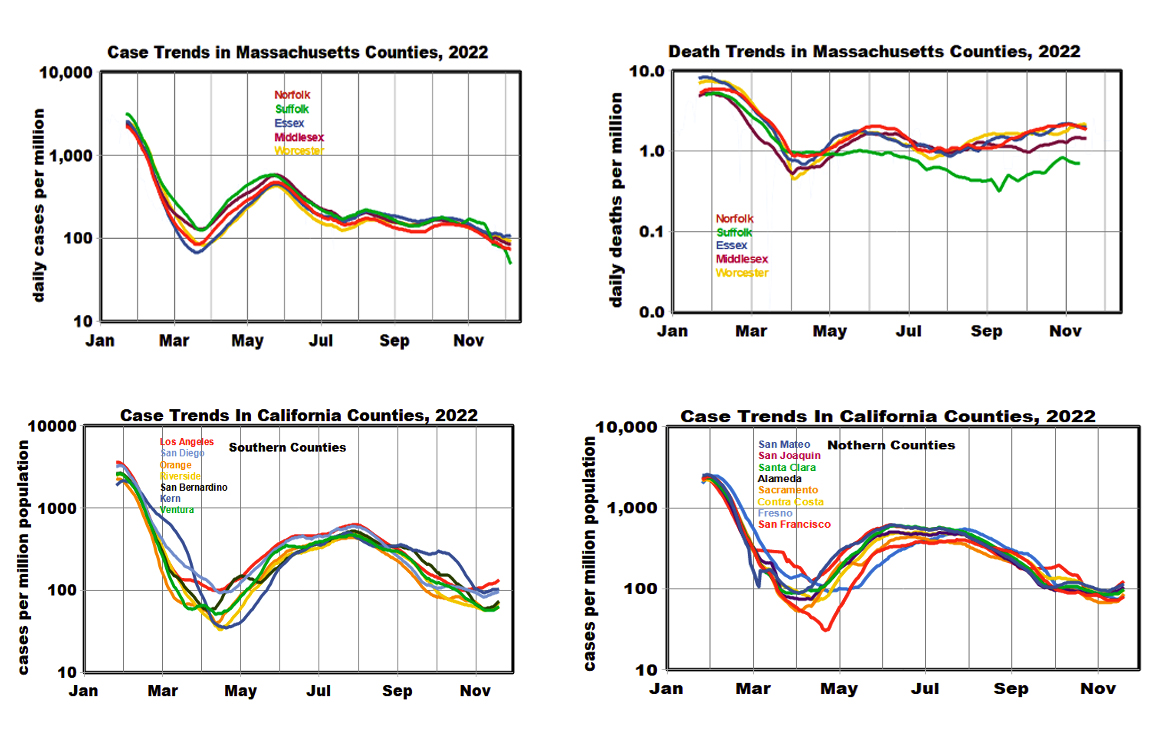
Next, we considered specific groups of counties in eastern and western regions. We saw similar trends in the variability of COVID cases and deaths: lower variability at high rates than at low rates. This dichotomy is especially notable in California.
 Discussion
In most of our previous analyses, the underlying (but unstated) premise has been that “one size fits all” for places and periods. For example, we posited that if COVID case and death differences were associated with state-level political persuasion or population density in 2021, this would also be the case in 2022. While geographic factors remained constant during the pandemic, but the graphs above clearly show that COVID cases and deaths varied much more over time than among locations. They show that COVID surges had the same percentage effects at diverse locations and thus that such geographic factors are not universally applicable.
This phenomenon is only evident at fine spatial scales. It shows that spatial variability in cases and deaths is far less critical than temporal, reflecting the balance between viral exposure and evasion of immunity with defenses. Four main variants have been observed during the 36-month pandemic: Alpha, Delta, Omicron, and BA.5. Some variants, notably, Omicron and its BA.5 variant, spread rapidly, and differential variant effects during the pandemic tend to be piecemeal than continuous. Exposure evasion is essentially now a thing of the past.
With apologies to Tolstoy:
All cities suffered similarly from peak COVID levels, but each recovered in its own way.
Notes. All case and death counts were scaled to a 1 million population. Anomalous data for Jackson County, MO (Kansas City) and San Francisco were deleted.


