Most of us would say “good” after little deliberation, as would virtually all of the media, but no purveyor of motor fuels would agree, and number crunchers would say, “it depends.”
The basic concept involves transferring vehicle energy requirements from a distributed local scale to a regional institutional scale, each having its environmental impacts. Most of the technical literature and virtually all the media focused on a national view assume that electric vehicle (EV) charging stations are somehow connected to a virtual power plant in the sky. [1] Here I consider pollution tradeoffs and spatial relationships among the contiguous states.
Did EVs reduce local traffic-related air pollution in California at the cost of more air pollution from power plants elsewhere?
Assumptions
I make the following assumptions:
- EV registration is an indicator of actual EV use, i.e., all EVs accumulate the same annual mileage.
- Previous state-wide annual averaged air quality represents current situations.
- Ambient black (elemental) carbon (BC) and oxides of nitrogen (NOx) represent emissions from gasoline and diesel-powered vehicles.
- Fine particulate concentrations (PM2.5) represent the dominant effects on ambient air quality where coal produces electricity.
- Traffic noise and coarse particles from road, brake pad, and tire wear are the same for EVs.
Air Quality Data
Fine particle concentration (PM2.5) is the metric typically used to compare ambient air pollution effects of particulate matter - EPA regulations creating widespread availability of ambient monitoring data. I subdivided PM2.5 sources and moieties into three major groupings:
- Internal combustion engines used in transportation (incomplete combustion of carbonaceous species, especially nanoparticles)
- Boilers used to make steam for power generation (inorganic fuel contaminants like sulfur)
- Minerals from suspended crustal sources (Al, Ca, Fe, Si, etc.)
All three are found in ambient PM2.5, with typical particle sizes ranging from (microns) ~0.1 (BC), ~1 (NH42SO4) to > 2 (mineral dust). The smallest particles are generally the most harmful since they can penetrate the deepest into our lungs. Relatively few epidemiology studies have compared health effects by PM2.5 constituent, in which associations with traffic-related PM are pronounced.[2]
Oxides of nitrogen (NOx) form during combustion as NO, which then oxidizes to NO2; NO formation is highly dependent on the temperature of combustion [3]. Diesel and high-performance gasoline engines run much hotter than industrial boilers and produce more NOx per unit of fuel consumed. Transferring from internal to industrial combustion could thus prove environmentally beneficial.
Interrelationships among these parameters are shown by their correlations and the corresponding graph.[4]

We see a near-perfect correlation between the two auto exhaust indicators (BC, NOx) and more modest but similar correlations among all other parameters save coal usage, which is negatively correlated with the other 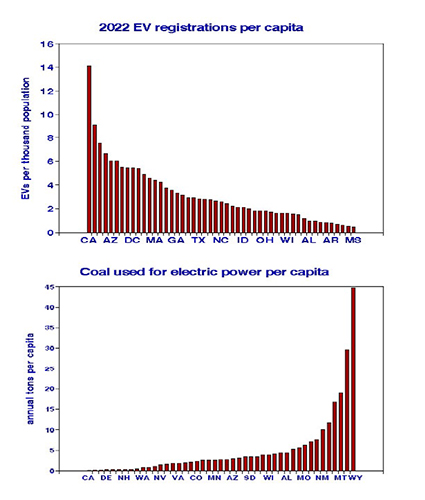 parameters. These correlations imply that EVs are more likely used in higher traffic states but less so in states that favor coal to produce electricity. These geographic correlations do not imply cause and effect; they show that EV registrations are generally more common in states with more vehicular traffic than those with more coal-fired power plants. Black carbon (BC) and NOx both increase with EV registrations, more so than with PM2.5. The negative relationship of EVs with power-plant coal usage is also weak.
The bar graphs show how states ranked in terms of EV registrations (median = 2.4 EVs per thousand population) and tons of coal used to make electricity (2.1 tons per capita). California and the West are highest for EVs, and other western and Appalachian states are highest for power-plant coal usage. The two graphs nearly mirror each other and show ranges of more than 10-fold across the nation. National averages are misleading.
EVs and Air Pollution by State
 The underlying national concern is whether the effects of increased power-plant emissions from EV demands might cancel health benefits from reduced vehicular emissions. This geographic analysis helps lay that concern to rest. States heavily dependent on coal-powered electricity are seeing minimal demand for EVs. States with the most EVs do not rely heavily on high-polluting coal to generate electricity. As a result, the high EV states should be getting healthier with little change elsewhere.
To better illustrate this distinction, I computed EV registrations per ton of coal used to produce electricity and plotted their ranked order. The EV States (i.e., California and the Northeast) produced the electricity to power 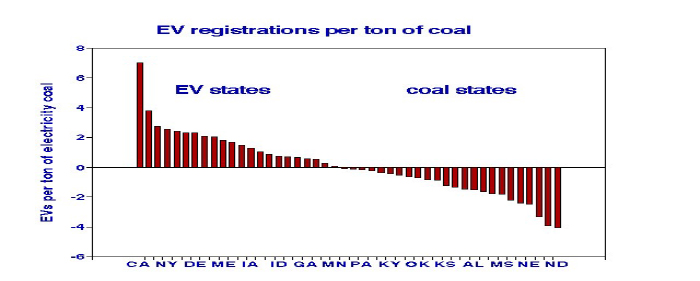 EVs with little air quality penalty. Too few EVs were registered in the Coal States (i.e., the South) to impact air quality
Higher educational levels and household income were strong factors in state-wide EV registrations; overall population and household size were less so. Race appeared to make no difference.
Climate Change Tradeoffs
- Typically, an EV can travel about 4 miles per kWh, and a coal-fired power plant requires about 10,500 Btu to produce that kilowatt, for an EV mileage rate of 380 miles per million Btu (Mbtu).
- An internal combustion-powered car can travel about 22 miles on a gallon of gasoline that produces about 120,000 Btu, for a rate of only 180 miles per Mbtu.
- EVs use about half as much energy as a gas-powered car and produce almost half as much CO2 to accomplish the same task. Transferring transportation energy from gasoline to EV electricity saves energy and reduces CO2.
Relative Environmental Merits of EVs
Non-combustion emissions (road, brake, tire particles) will remain whether we use gas or electricity.
Good. By improved efficiency, switching to EVs reduces CO2 regardless of the electric power source. Where “clean” (solar, wind, light oil, gas, hydro, nuclear) fuels are used to produce the required electric power, ambient air quality will also improve. Traffic noise will be reduced in any event.
Indifferent. Where “dirty” (coal, wood, municipal waste) fuels are used to produce the required electric power, ambient air quality may deteriorate, depending on the power plant pollution controls in use.
Bad. Large-scale (> ~50%) introduction of EVs will require redesign and rebuilding of the local electric grid involving new power plants, substations, and transmission lines, as well as dealing with differences in peak load scheduling.
[1] Public Health and Climate Benefits and Tradeoffs of U.S. Vehicle Electrification GeoHealth DOI: 10.1029/2020GH000275
[2] Air pollution references
Traffic-related PM2.5 and its specific constituents on circulatory mortality: A nationwide modeling study in China. Environment International DOI:10.1016/j.envint.2022.107652.
Associations components and mortality in Massachusetts: mixture analysis exploration. Environmental Health. DOI:10.1186/s12940-022-00907-2.
Long-term exposure to air pollution and mortality in a Danish nationwide administrative cohort study: Beyond mortality from cardiopulmonary disease and lung cancer. Environment International DOI: 10.1016/j.envint.2022.107241.
Long-term exposure to PM2.5 major components and mortality in the southeastern United States. Environment International DOI: 10.1016/j.envint.2021.106969.
Revisiting the Veterans Cohort Mortality Study: New results and synthesis. Journal of Air Waste Management Association DOI: 10.1080/10962247.2018.1498409.
[3 Correlation of Gas Turbine Emissions Data, 1972. American Association of Mechanical Engineers DOI: 10.1115/72-GT-60
[4] I divided by the state populations to standardize the EV and coal usage data and used their logarithms in the statistical analyses. Only 45 states reported coal usage data.