
“The World Health Organization estimates that air pollution kills as many as seven million people a year.”
Early epidemiology studies were concerned with short-term effects associated with daily changes in ambient air quality. However, a 1970 publication attributed differences in long-term survival rates among cities to concurrent long-term ambient air quality during a specific period. This so-called cross-sectional methodology has been widely applied and was the basis for the WHO estimate. The WHO finding has been cited in 232 papers and now seems to be taken as gospel, but it is conflated by including the effects of smoking and indoor cooking with solid fuels.
Data
I considered public data on US general populations’ life expectancies at birth and all-cause mortality rates for ages 25-34, 45-54, 65-74, and 85+ from 1900 to 2022. Mortality rates from age 45 and older show continuous declines but less so for ages 24-34; life expectances increased continuously. The near-parallel mortality and PM2.5 trend lines suggest that improved ambient air quality may have contributed to reduced mortality rates.

I chose airborne particulate matter (PM) for this analysis because of its extensive database and persistent press coverage. Systematic PM data collection began in England in the 1950s[1] based on the blackness of sampling filters, from which the collected mass of largely soot particles was estimated. Such systems were also used in New York City, Philadelphia, and other large cities, but they provided no information on the chemistry or toxicity of the airborne particles. The US Public Health Service began collecting air samples in 17 cities in the mid-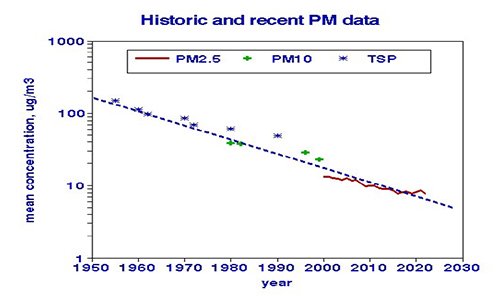 1950s, then expanded to 250 locations nationwide. That network collected 24-hr samples by filtration every two weeks, which were weighed and analyzed for elemental content. Concentrations of airborne particles are still primarily based on weights collected by filters and have decreased about 20-fold overall, as shown in the graph.
Particle size is important for health considerations since the smallest particles penetrate deepest into the lung and beyond, but the largest particles contribute the most mass. The earliest sampling systems measuring total suspended particles (TSP) did not discriminate by particle size, but in the 1980s, a sampler was developed, partitioning the collected material into “fine” (PM2.5) and “course” (PM10) fractions. The two categories are highly correlated, making their distinction less critical for trend analysis. Here I merged them with TSP to examine the overall trend.
Epidemiology is never that simple because population trends are rarely singular or reflect only independent effects. Economic improvements may enable more driving, increasing local combustion emissions, noise, and road dust, but these improvements may reduce smoking and create better access to medical care. It is thus necessary to control confounding factors.
Confounding a relationship between x (PM) and y (mortality) occurs when one or more additional factors z… is correlated with both x and y and thus shares that relationship. Confounding can be rampant in environmental epidemiology. Daily changes attributed to air quality are confounded by holidays, weekends, and weather. Differences in air quality among locations, the basis for the WHO mortality claims, are confounded by differences in income, education, diet, physical fitness, smoking habits, alcoholism, body mass index, indoor air pollution, race, climate, and altitude. However, when considered spatially, most of these differences remain relatively constant and cannot confound longitudinal analyses such as this one.
I selected three potential longitudinal confounders. [2]
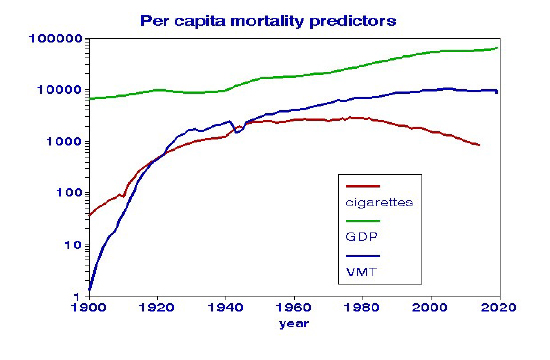
- Gross domestic product (GDP) is a measure of the overall economy. Departures from the general upward trend include a dip during the Great Depression, recovery after World War II, and leveling off during the early 2000s. Increasing GDP (after adjusting for inflation) may reflect better access to medical care and the increased use of pollution-emitting devices.
- Vehicle miles traveled (VMT) reflects traffic density and emissions from internal combustion engines. That trend shows a pronounced dip during WWII, after which it essentially followed the GDP trend.
- Tax-paid cigarette sales models smoking habits. There was a sharp rise during WWII that leveled off in the 1960s when health effects became more widely recognized. Although this smoking metric does not include cigars or pipe tobacco, it captures smoking intensity and may also reflect indoor passive smoking.
Although the pollution-mortality analysis covers a shorter period, the conformance of these potentially confounding variables with recognized events strengthens their validity.
Relationships since 1980
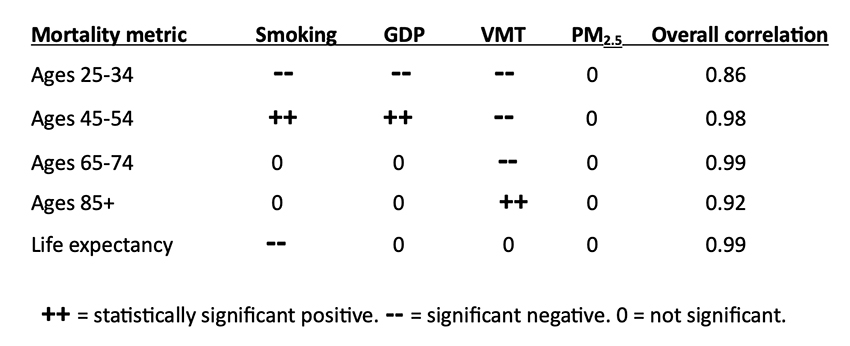
Each factor was a statistically significant predictor of mortality when considered one at a time; smoking and PM2.5 appeared to be the strongest. With all four predictors considered jointly, the overall correlation improved, but the significance of PM2.5 was lost. To further illustrate the sensitivity of PM2.5 models to confounding variables, I added random errors to the cigarette consumption data. Modest levels of error shifted the “responsibility” for changes in life expectancy from smoking to PM2.5. This may explain why other analyses that used less-comprehensive smoking measures reported significant effects of PM2.5. [1]
What can be learned from this trend analysis?
The population metrics demonstrate the influences of wars, recessions, and other of our economic and social behaviors.
- Population health improved steadily before COVID.
- The economy continues to strengthen.
- Vehicle use has leveled off.
- Smoking has decreased to the levels of the late 1930s but remains the most important predictor of longevity.
- Mortality relationships with PM2.5 are sensitive to the inclusion of potentially confounding variables in the regression models.
Since the 1970s, long-term air-pollution-mortality studies used to set regulatory policies were based on differences among cities, as if moving from, say, Steubenville, Ohio, to Berkley, California, would instantly add years to your life. By contrast, this longitudinal approach is based on the precept that the future can’t be predicted without understanding the past.
[1] Lipfert FW, Air Pollution and Community Health. Wiley, 1994. ISBN-13 978-0471285601
[2] Trends are displayed on a log scale to facilitate comparisons.
[3] This analysis only covered PM2.5, a mixture of many different types of particles. Concentrations of many other pollutants have declined following the Clean Air Act of 1970, notably a 91% reduction in sulfur dioxide from power plants and a 79% reduction in carbon monoxide from traffic. Their particulate counterparts would be sulfates (SO4) and elemental carbon (EC). It is possible that some constituents of PM2.5, rather than its total mass, may be more relevant for health effects. A recent European study showed that nitrogen dioxide (NO2) was just as important as PM2.5.


