How many cookies are too many? A new meta-analysis links greater consumption of ultra-processed foods to several chronic diseases and even reports dose-response relationships. But look more closely, and the size of the risk depends substantially on how researchers define a “dose”—raising a more fundamental question about what, exactly, they are measuring.

A new meta-analysis in a BMJ Group journal argues for a dose-response association between ultra-processed foods (UPFs) and chronic illness. It grabbed a lot of headline clicks in discussing what I would term the two-cookie problem. How many cookies does it take to satisfy you without harming your health? Time to “consume” the article and see if it is “whole” science or ultra-processed junk.
Nine Million People, but a Noisy Measure
The meta-analysis sought prospective studies in adults “exposed” to UPFs defined by the NOVA classification, winnowing the search from over 10,000 reports to 51 prospective studies that were the basis of the researchers’ findings. Overall, the 51 cohorts included nearly 9 million adults across a wide range of ages and follow-up periods. Most studies were European or American, examining cardiovascular events, cancer, all-cause mortality, hypertension, metabolic syndrome or diabetes, digestive disease, obesity and depression/anxiety.
Although the studies were judged to have a low risk of bias, the overall evidence was rated as low certainty. This separate judgment reflects how confidently the combined evidence can support a conclusion. Dietary intake in these studies was self-reported, adding measurement uncertainty. The NOVA classification adds another layer of uncertainty because nutritionally and biologically disparate foods can be grouped together as UPFs. While age, as a confounder, was routinely adjusted, other confounders like lifestyle were inconsistently addressed.
In short: this is an exceptionally large and broadly selected prospective observational dataset. However, the exposure measurement is noisy and the authors themselves ultimately judge most of the evidence to be low certainty. Before asking what a “dose” means, though, it helps to see the pattern the researchers found.
The Headlines: More UPFs, More Disease
- Obesity showed the highest-quality evidence, with the highest UPF intake associated with a 23% higher risk and no measured variation (heterogeneity) between the 4 cohorts reviewed.
- Metabolic syndrome and diabetes showed a similar 24% increased risk, but heterogeneity- the range of effects across the eight cohorts was extremely high.
- Across eleven cohorts, cancer demonstrated a statistically significant but clinically small impact of UPFs, a 12% higher risk.
- Hypertension showed no statistically significant association. Cardiovascular events were associated with a 24% higher risk, but the apparent dose-response relationship depended heavily on how UPF intake was measured — a distinction that becomes central to the two-cookie problem.
- All-cause mortality showed an 18% higher mortality between those consuming the most and the least UPFs
The highest-versus-lowest UPF consumption comparisons produce fairly uniform relative increases. But when researchers try to quantify how much risk accompanies an additional “dose,” the choice of measurement matters.
The Two-Cookie Problem: What Counts as a Dose?
The headline comparison showed a 24% higher risk of cardiovascular disease for those consuming the most UPFs than those consuming the least. But UPF consumption has no single standardized unit of exposure: a “dose” can be expressed in servings, grams, or as a proportion of a person's diet. The researchers, to their credit, consider several. Here is the data.
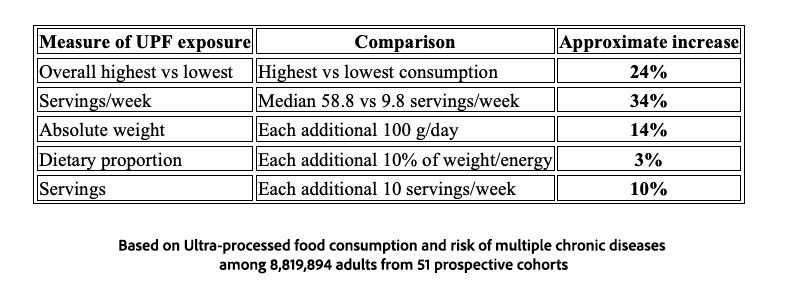
Servings/week is not a standardized quantity. Servings of soda, packaged bread, breakfast cereal, or processed meat don't represent comparable exposures to calories, sodium, fat, sugar, additives, or other potentially relevant components. While grams per day measures absolute mass, 100 grams of soda is treated the same as 100 grams of granola, despite very different nutritional exposures.
Dietary proportion refers to the proportion of a person’s total diet that consists of UPFs, using total food or energy intake as the denominator. It produces a substantially different value from absolute consumption found in grams or servings. Using that measure, each 10-percentage-point increase in UPFs' share of the diet was associated with an estimated 3% increase in cardiovascular risk, a particularly modest amount.
This sensitivity to measurement matters because the different metrics are proxies for the same underlying exposure: UPF consumption. While they all agree on the direction of association, the effect size is considerably smaller. What remains much less clear is how much additional risk, if any, to assign to one additional cookie.
And cardiovascular disease is not the only outcome for which changing the ruler changes the apparent dose-response relationship.
When the Ruler Changes, So Does the Risk
Consider the two chronic illnesses that are clearly diet-related: obesity and metabolic syndrome/diabetes. In the obesity analysis, UPF exposure was expressed largely as a percentage of daily food weight or energy intake. Across four cohorts totaling about 135,000 participants, the estimates were similar: people in the highest UPF category had about a 23% greater hazard of developing overweight or obesity than those in the lowest category. But after researchers adjusted for participants' BMI at the start of the studies, the trend remained while the apparent dose-response relationship became substantially weaker.
That attenuation suggests that baseline body weight accounts for some of the observed association between UPF intake and later overweight or obesity. In other words, the apparent UPF dose-response depends partly on what researchers adjust for and how they define the dose.
When considering metabolic syndrome/diabetes, the choice of dose is the mirror image of cardiovascular disease. An additional 100 grams of UPFs per day was associated with only a 2% increase in risk, whereas a 10-percentage-point increase in UPFs as a proportion of the total diet was associated with a 16% increase. The choice of ruler didn’t just change the size of the estimate; it also changed which measure was the larger one.
Those contrasting results bring us back to the deceptively simple question posed at the beginning: How many cookies are too many?
So, How Many Cookies?
Across millions of people, greater UPF consumption repeatedly tracks with greater incidence of several chronic illnesses. What this meta-analysis cannot tell us nearly as confidently is how much additional risk comes with each additional UPF. A “dose” measured in grams, servings, or proportion of the diet yields strikingly different risk estimates.
That leaves the two-cookie problem unresolved. The study supports an association between greater UPF consumption and several adverse health outcomes, but it cannot tell us whether one, two, or three additional cookies meaningfully change an individual's risk—or whether cookies are even a useful unit for thinking about that risk.
To answer the question I began with, the study is neither “whole” nor “junk” science. We should consume it in moderation, and we can avoid the tastier, less nutritious social media headlines it provoked.
Source: Ultra-processed food consumption and risk of multiple chronic diseases among 8,819,894 adults from 51 prospective cohorts: a dose-response meta-analysis. Family Medicine and Community Health. DOI:10.1136/ fmch-2026-003925
Category

Chuck Dinerstein, MD, MBA
Director of Medicine
Dr. Charles Dinerstein, M.D., MBA, FACS is Director of Medicine at the American Council on Science and Health. He has over 25 years of experience as a vascular surgeon.