The researchers made use of population density, social distancing, and climate in looking at the number of COVID-19 cases at the county level. They excluded counties with few cases, and sparse populations, each county had to have a city of at least 100,000 or contain the state capital. This left them with 211 counties representing just over half of the US population.
- Population density, based on the US Census was modified to account for demographic differences. Specifically, they defined a conversion factor, to try and identify the susceptibility of the population to COVID-19, age over 65, income less than 200% of federal poverty standards, and the presence of diabetes. We can quibble over the choices, or you can add as many grains of salt as you feel necessary.
- Social distancing was based upon cellphone data showing locations and the subsequent reduction in visits to nonessential businesses. Using the term “social distancing” in this case, reflects more the degree we “locked-down” and stayed home than our six-foot interpersonal distancing.
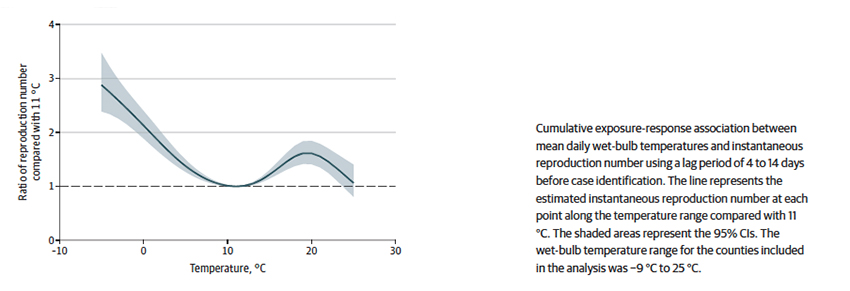
- Temperature and humidity, as I have written, both play a role in the viability and transmission of COVID-19. As the researchers write, “the primary weather variable we used was wet-bulb temperature, a metric that captures the complex thermodynamic relationship of temperature and humidity, has been shown to predict human health events with more precision than temperature and humidity separately…” [1]
Findings
- R0, the measure of infectivity/susceptibility to COVID-19 was not fixed geographically or temporally. That should come as no surprise
- In aggregate, the top 21 counties by population density the R0 was 5.7 vs. 3.1 in the bottom 84 counties. For the same counties, the top 21 reduced nonessential visits (that social distancing metric) by 77%, the bottom 84 by 66%. The top 21 counties also had lower wet-bulb temperatures, 5.9 °C vs. 7.9 °C
- As expected, the R0 was higher in more population-dense counties, roughly 15% greater between the top 21 counties and the bottom 84.
- Reducing nonessential visits decreased the R0 in a roughly linear way with a 25% reduction reducing the value by 27%, and a 75% reduction reducing R0 by 60%
- Perhaps the newest wrinkle was a non-linear relationship of R0 to wet-bulb temperature, as depicted in the graph. Compared to 52 °F, its’ nadir, R0 increased two-fold at 32 °F, and 1.6 fold at 68 °F, before again declining.
 The researchers concluded that social distancing, the only one of these three variables we can control, is a successful means of reducing the spread of COVID-19. But that is something we already knew.
What was more important, at least to my eyes, are those wet-bulb readings that capture temperature and humidity. Like good researchers, they tried to reconcile this bimodal curve to what is already known about the transmission of viruses at varying temperatures and humidity. They also point out that temperature will affect our behavior, including social distancing, and may not be measured in their study. While they point to hot weather causing more people to go to the beach, perhaps from a public health point of view, we should point out that warm weather brings more people indoors to air-conditioned climates often around that 20° C (68° F) mark suggesting that how we structure our indoor social distancing might have a more significant impact
There are many limitations to the study, beginning with case counts of COVID-19, which we know are partially sensitive to the degree and sites of testing. The time frame of the study fails to account for the surges in infection in June and July; and cellphone locations are not an exact proxy for social distancing. Finally, the use of county-wide wet-bulb values fails to account for our time indoors, in environments that may be quite different, especially when it is very cold or warm outside. There is no ‘aha’ moment to the study; science doesn’t work that way. Science is an accretion of facts, points that ultimately paint a picture. The value here is in suggesting that local climate plays a role and that its role is, as always, complex.
[1] A quick primer, dry bulb temperature, is air temperature. Dew point is the temperature where the water begins to condense out of the air. Web bulb temperature is the temperature taken with a water-soaked gauze surrounding the thermometer bulb and reflects the humidity in the atmosphere. Its value lies between air temperature and dew point.
Source: Association of Social Distancing, Population Density, and Temperature With the Instantaneous Reproduction Number of SARS-CoV-2 in Counties Across the United States JAMA Network Open DOI: 10.1001/jamanetworkopen.2020.16099

Chuck Dinerstein, MD, MBA
Director of Medicine
Dr. Charles Dinerstein, M.D., MBA, FACS is Director of Medicine at the American Council on Science and Health. He has over 25 years of experience as a vascular surgeon.


