COVID-19 infections are relentless. In every state, November rates increased over October, more than doubling on average. And these rates are widely dispersed across the nation. Early COVID-19 cases and deaths were associated with local conditions, including residential crowding and household income. More personal factors have since come into play as the pandemic spread and hotspots shifted to the heartland.

Face masks are an important way to limit new COVID-19 infections, but since mask wearing has become politicized and the subject of derision in some areas, we questioned whether additional personal characteristics might be important. We used public data on frequencies of face mask usage and the national election results to contrast November’s average COVID-19 infection and mortality rates per million population. We considered the 48 contiguous states and 25 selected counties that include large cities.
COVID-19 rates vary widely, hence our use of logarithmic scales. November death rates for counties varied by a factor of 25, states’ infection rate by a factor of 16. The figures below show that this variation is not random but has strong positive relationships with voting Republican (left) and negative with face-mask usage (right). These are essentially mirror images, consistent with their strong negative inter-correlation (R=-0.76). Relationships with cases and deaths are similar.
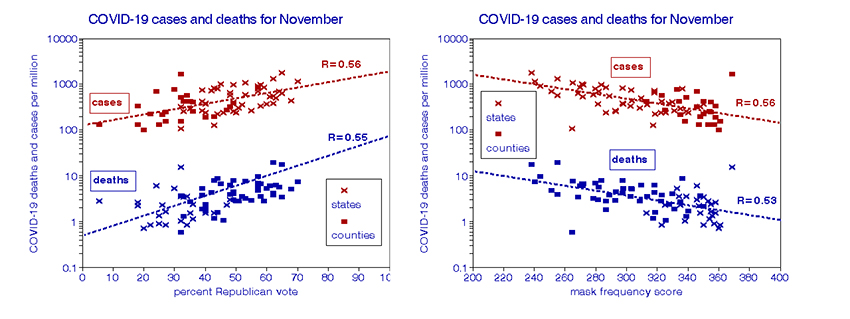
We used multiple linear regression to estimate the separate effects of politics and mask usage on COVID-19 rates; both were statistically significant. According to these calculations, a Republican voter would bear an increased risk of COVID-19 death by a factor of 7 and a factor of 4 for infection. Not wearing a mask would entail an additional risk factor of 9 for mortality and 12 for infection. The combined risk factors were 61 for deaths and 54 for infections. We found these estimates valid for both states and counties, thus ruling out spatial inhomogeneity as a confounder. These large individual risk estimates may seem extreme, but they are consistent with the ranges in COVID-19 rates mentioned above and shown in the figures.
What do they really mean?
These relationships are much stronger than those found in similar studies of other diseases and agents; the relative all-cause mortality risk of smoking is only a factor of 2, for example. COVID-19 mortality rates are now high in the Dakotas (18-20 deaths per million population) and much lower in Maine and Vermont (0.6 – 1.2 deaths per million), a 20-fold difference. While both regions have similar population densities, climates, and demography, they have very different politics and COVID-19 rates.
COVID-19 rates among states are highly correlated between adjacent months, but correlations between May and November rates are virtually zero. Neither populations nor physical environments changed during the 9-month pandemic, which leaves changes in personal attitudes and behaviors as possible explanations for this diversity along with possible virus mutation. If time-dependent differences in individual behavior, attitude, and the resulting exposures are responsible for this heterogeneous spreading of the pandemic, they must be recognized in the search for remedies.
This current situation of conflicting attitudes towards the pandemic poses a daunting challenge to public health. One can only hope it will not extend to a problematic acceptance of the vaccines now on the way.