
Methodology
We computed rates of infections (cases) and deaths by dividing by the appropriate population expressed in millions. Cumulative effects are summations of daily rates over time. The overall average daily case rate is about 225 new cases per million per day, while the overall mean death rate is about 4 per million per day. Thus, about 6% of the U.S. population has been infected, and 1.8% of the infected have died from COVID-19. These effects are not linear and vary substantially across the nation.
We utilized daily data for the 48 contiguous states grouped into six geographic regions [2]; we did not analyze trends for individual states or cities. For clarity, we smoothed the graphs by using moving averages of the ten days before and after a specific date. We use logarithmic scales commensurate with the exponential nature of the pandemic.
Results
Figure 1 depicts regional trends for daily new deaths, cases and their ratio, the case fatality rate (CFR). During this period, case rates increased by an order of magnitude (30% per month), death rates increased by about 10% per month, and case-fatality rates decreased by about 25% per month. By September, the six regions had merged into a common pattern of increasing cases and deaths. The variation among regional case and death rates at year's end was about 20%, having been as high as 80% earlier; within-region variability exceeded an order of magnitude in some situations. Average case rates began to decrease in December, and the death trend curves began to flatten. There are apparent "waves" in July and November cases, with deaths and case-fatality rates following somewhat later.
 Regional differences in rates were substantial early on - an order of magnitude between the Northeast and Northwest. New York City was hit early and hard; hospitals scrambled to keep up with demand, and wearing masks and maintaining social distancing had not yet taken hold [3]. By contrast, Washington State declared an emergency on February 29 following a COVID-19 outbreak in a nursing home [3]. Regional average cases for the NE and NW regions differed by a factor of about 8 in April but were virtually identical by November. This trend towards a common mean was also seen in individual states; these systematic differences may have reflected virus variants.
Case-fatality rates (CFRs) reflect age-related differing virulence and increasing adequacy of medical care. Deaths lag cases by several weeks, corresponding to an infection's time to develop lethal consequences. Neglecting lag time underestimates the true CFRs. When we incorporated a three-week lag in our CFR calculations the December CFR slope decreasing from positive to nil.
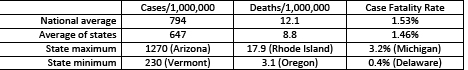
Our approach of considering each state as an independent sample without population weighting provides a different perspective than the national averages used in the media, as shown below for January 1-8, 2021. Weighted (national) averages are dominated by the large states, California, New York, and Texas, and obscures the enormous variations in rates among states, by factors of 5.5 to 8. COVID-19 infections and deaths also varied substantially by region (Figure 1). For comparison, the lowest international rates are < 10 cases per million with CFRs around 1%.
We are also interested in the changes in daily rates over time (CDR), i.e., whether daily rates of cases or deaths may be accelerating (positive CDR) or decelerating (negative CDR). When CDR = 0, daily rates are steady [1]. The CDR trends accentuate the peaks and valleys in daily cases and deaths (Figure 2). The increase in CDRs lessened after their initial surge, ostensibly as exposure limitations began to take hold, and stabilized around June. Again, the NE region shows different movements, but the other regions were less variable compared with Figure 1.
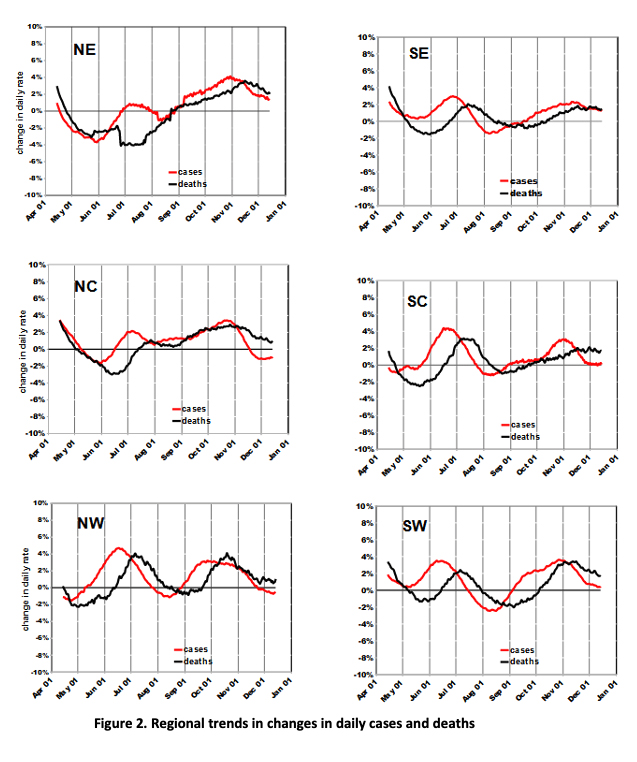 The maximum CDRs were about 4% (i.e., daily rate 4% larger than previous day) and there are no periods of sustained acceleration that might indicate uncontrolled spreading. Rates increased into July, stabilized in August-September, and then accelerated into November. There are only a few instances of negative CDRs - about a 2% decrease for a few weeks in a few areas.
The uniformity among regions in Figures 1 and 2 seems remarkable, given the nation's diversity in terms of demographics and environments. Our analyses of earlier data identified population and housing density, race, and income as associated with COVID deaths. However, these characteristics remained constant during the pandemic, suggesting that the geographic variability seen in Figure 1 is most likely due to differences over both space and time in individual exposure or it’s avoidance. Not wearing a face mask increases COVID-19 mortality risk by a factor of 10. National average face mask use is about 50% in the U.S. Doubling mask use would essentially flatten the daily death curves of Figure 1, according to these estimates.
Conclusions
Regional daily case rates are now declining and death rates may follow, given typical lag effects and stable case-fatality rates. Compared with typical epidemiological studies of other health outcomes and agents such as smoking-related mortality [4], COVID-19 health effects are huge.
We can now offer some very rough predictions:
- Regional differences in COVID-19 rates will continue to decline.
- Daily case rates may be approaching a peak, perhaps due to the public's greater interest in limiting exposures and to the beginning of widespread vaccination.
- Death rates will decline faster than cases because less vulnerable populations are being infected and medical care has improved.
- As a result, case-fatality rates will continue to decline.
These order-of-magnitude differences over time and among locations indicate the importance of reducing exposure by using face-masks, maintaining social distancing, and avoiding crowds. Failure to comply involves mortality risks greater than for a lifetime of smoking.
1] For those who can recall Calculus 101, the daily rate is the first derivative of COVID effects, and the daily change in that rate (CDR) is the second derivative.
[2] Regional designations of states. NE: CT, DE, ME, MA, PA, RI, VT, NH, NJ, NY. NC: ID, IL, IN, IA, MI, MN, NE, OH, WI, ND, SD. NW: MT, OR WA, WY. SE: AL, AR, FL, GA, KY, MD, MS, TN, VA, WV, NC, SC. SC: KS, LA, MO, OK, TX. SW: AZ, CA, CO, UT, NM, NV.
[3] Wright, L. The Plague Years. The New Yorker, January 24, 2021. Pp. 20-59.
[4] Death rates are roughly doubled for lifetime heavy smokers.


