
We constructed a comparison “rural” dataset by subtracting the urban case and death counts from the state totals to assess urban-rural differences. Our objective was to determine if the time history of the pandemic differs between major cities and the rest of the nation.
Methods and Data
Data were obtained from the Github database [1] from March 2020 to mid-May 2021 and converted them to rates by dividing by the population (in millions).
We used monthly averages to reduce random variations. Ninety-six of the 100 counties had populations > 600,000. We added four smaller counties (~100,000) to provide better geographic balance, to create five regions with about 20 counties each [2].
Results
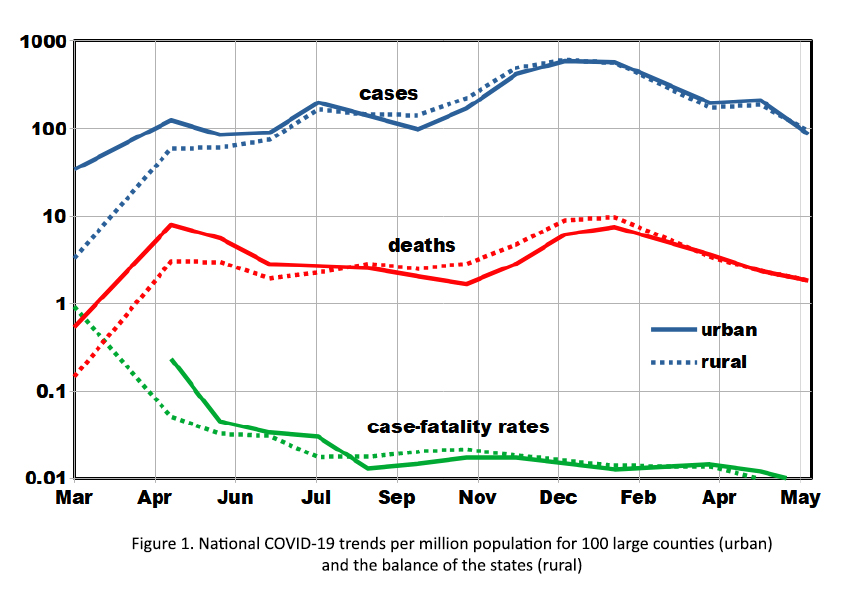
Figure 1 shows how cases, deaths, and case-fatality rates (CFR) varied for urban and rural locations during the pandemic, based on monthly averages.
- There are three successive peaks in cases, each followed by a steady decline after December.
- Death rates lagged by about a month.
- Urban case rates exceeded rural by about a factor of 3 in the spring of 2020 but reversed in the fall.
- Overall, rural case rates essentially doubled the urban values.
Urban-rural differences in the fatality rates of cases (CFRs) may reflect either population demographic differences or the efficacy of medical care. They stabilized in the fall with negligible differences between urban and rural locations.
Figure 2 shows regional variations.
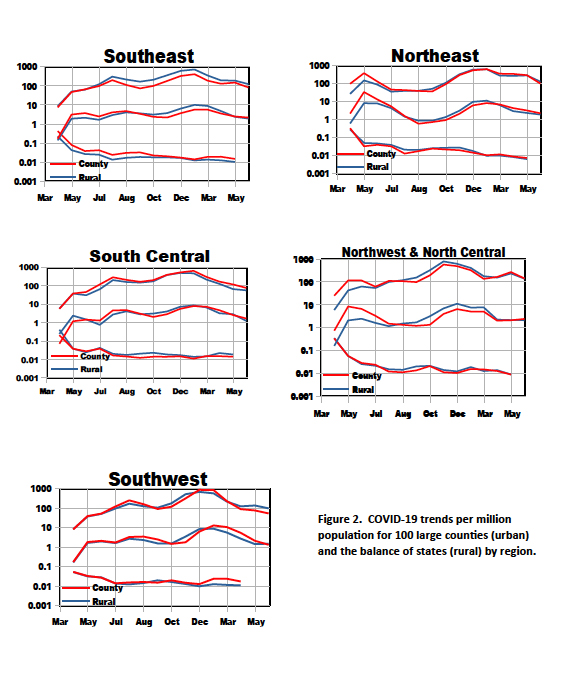
- The overall temporal patterns are similar among the regions.
- Case fatality rates show less temporal and regional variability.
- The overall impression from the figures is that the temporal variations of about an order of magnitude far exceed any urban-rural differences. Nevertheless, doubling (or halving) a mortality rate could be a serious matter worthy of investigation.
In general, two sources of variations in COVID-19 may be envisioned: those grounded in location that remained essentially during the pandemic, such as population density or socioeconomic status (SES), and variations stemming from behavior that may have changed, such as adhering to exposure avoidance guidelines. Therefore, the differences in outcomes may be primarily due to differences in responses to COVID-19, including differences between urban and rural behavioral patterns. However, there is little evidence of systematic geographic variations between regions, in contrast with the more significant temporal trends. Thus, we conclude that urban vs.“rural” residence has not been a significant factor in the COVID-19 pandemic. National trends are reasonably representative of regional trends in the context of variations over time.
[1] Original data can be found here.
[2] Definitions of regions can be found here.


