
We now know that exposure to the virus and subsequent infection depends not only where you are but how you behave. Since we may have more control over our behavior than locations, it’s important to try to separate these two factors. Our prior analyses focused on locations and that in addition to population density, i.e., crowding, the distance from New York City was an important predictor of COVID-19.
Density may be expressed in several ways. State-wide, it reflects the proportions of urban and rural residence; at county or city levels, the fractions of multifamily and high-rise dwellings; and for individual’s, the number of persons in the household. Density per se exerts no intrinsic health impacts but is involved with personal factors at each level, including demography, socioeconomic status, income, socialization. The social distance separation guideline of 6 ft is intended to reduce densities of gatherings, meetings, and performances.
Regional disparities lessened over time as the virus continued to spread and infection rates increased. Here we examine the roles of urban residence as a measure of density and perhaps behavior in selected states during the pandemic.
Methods
We compared rates of COVID-19 cases (infections based on positive test results) and associated deaths among counties designated as urban, and among the remainders of states designated as rural, based on 19 states and their major cities restricted to counties with densities > 2000 persons per square mile. Since small counties may have single-digit daily counts, finding statistically significant relationships among them requires aggregating over space, time or both.
In the urban-rural differences over time we analyzed COVID-19 trends in daily counts of cases and deaths, which exhibited large ranges and uneven distributions. We also analyzed case fatality rates (CFR), the ratio of deaths to cases, assuming a lag of 14 days between infection and death. We expressed rates on the basis of one million persons to standardize for population size. This part of the analysis comprises trends averaged over 19 states. We expect COVID-19 rates to be sensitive to population density which affects urban but not rural values. We adjusted the urban rates to approximately what they might have been at rural population densities.
Findings
The timelines (Figure 1) show similar cyclical patterns for urban and rural areas with 3 cycles of peaks and valleys, especially for CFRs.
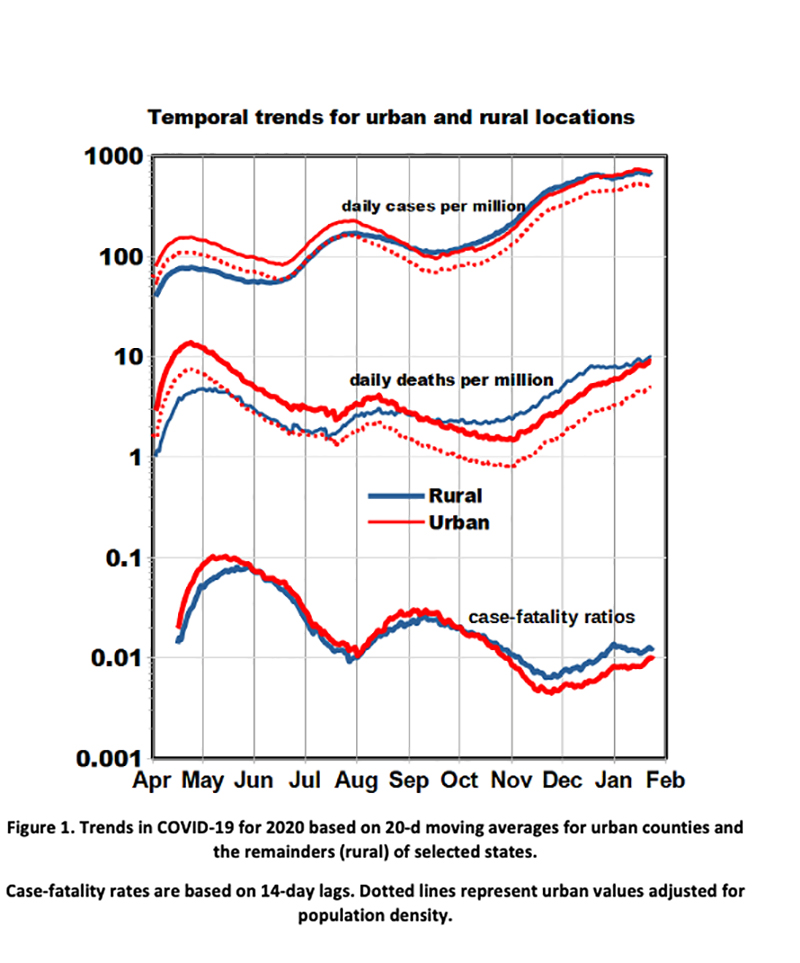
- The peak rates in April were heavily influenced by the denser northeastern locations.
- Urban and rural effects crossed over in September after which cases and deaths began a consistent pattern of increase, especially for rural areas.
- Overall case rates increased by an order of magnitude during the pandemic while overall death rates remained approximately constant. CFRs thus decreased by an order of magnitude, perhaps because of infections at younger ages or from improved medical care as the pandemic progressed.
- In late April urban cases exceeded rural by a factor of 2 and urban deaths by a factor of 3, but after November the effect reversed and rural deaths exceeded urban by a factor of 1.4.
After adjusting for population density, the urban-rural differences in Figure 1 may be related to demographic differences in behavior such as usage of face masks and adherence to social distancing guidelines.
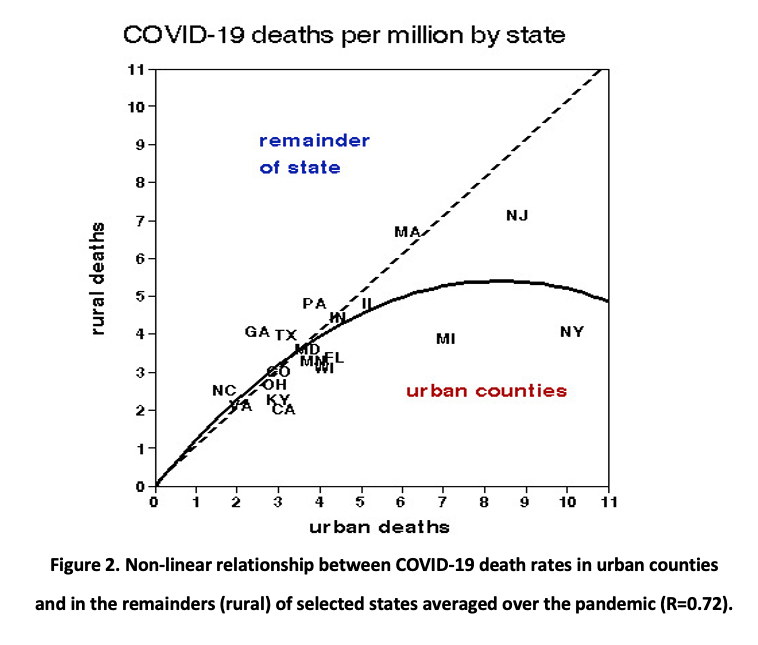 Figure 2 displays urban and rural COVID-19 death rates by state, together with a quadratic curve fit, averaged over the pandemic. There is no difference at the lower mortality rates but the curve is depressed by the high rates in New York and Michigan, both of which experienced early outbreaks. Urban but not rural death rates were significantly correlated with urban population density as was the urban/rural mortality ratio; case rates were not correlated with population density. Urban CFRs were also significantly correlated with urban population density.
Conclusions
Differences between urban and rural COVID-19 rates were not limited to effects of population density. Living in an urban area was indeed riskier last spring even after controlling for population density, but now poses no additional risk of COVID-19 infection or subsequent death. By contrast, rural rates now exceed urban after adjusting for population density, indicating that other factors may be responsible and suggesting that behavior may be more important than location. All of these geographic differences are much smaller than the large-scale cyclical variations in temporal trends.
Beach houses and country hideaways notwithstanding, be advised to stay in the city and follow the guidelines for limiting exposures.


