
“Governors were responsible for establishing interventions appropriate for their states and the timing of implementation.”[2]
In this period of virtually ubiquitous virus presence, we see COVID effects as a trade-off between exposure (controlled by demography and behavior, including masking) and response after infection (controlled by immunity due to prior infection or vaccination). Demographic factors like education, income, and population, are invariant over these time scales, and behavior has pretty much settled back into pre-pandemic norms, including masking. Exposure is thus now essentially a spatial variable [3]. Our response, accommodation, is both spatial and temporal because of vaccination trends and the arrival of new virus variants. We analyzed spatial variability among states over a limited period to determine inter-relationships and relationships with accommodation, i.e., vaccination rates. The outcome metrics are a progression of severity, from positive tests to deaths.
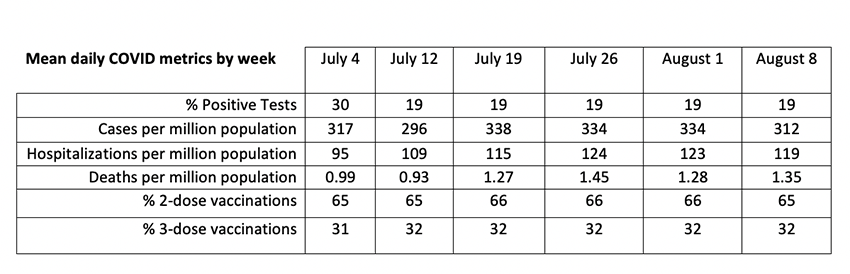
We compared the following COVID-19 metrics:
- Average percentages of tests reported positive in the past 14 days.
- Daily new cases (infections) based on 7-day moving averages, including probable cases and those confirmed by testing.
- Weekly rates of hospitalization.
- Weekly rates of mortality.
- Percentages of state populations vaccinated in the original series (2 shots).
- Percentages who received both original and boosters (3 shots).
We analyzed weekly data from each state from July 4 through August 8, 2022, computing overall averages for this period. We used logarithms to directly compare rates of change of the various metrics based on graphs and statistical correlation analysis. These mean values are not population-weighted; each state represents an independent sample, increasing diversity at the expense of precision.
Temporal trends were minimal during this 6-week period: Hospitalization and mortality rates increased while cases and positive tests remained steady, suggesting lag effects. About 35% of cases were hospitalized but only 0.38% of cases died. The COVID-19 test data may be “unduly noisy” because of variations in local reporting protocols.
 Correlations across states showed that the only significant relationship among the four metrics was between cases and hospitalizations. The population percentage with 3-dose vaccinations was the best indicator of improved COVID outcomes. COVID death rate was not significantly correlated with other outcomes or vaccination rates, perhaps because of lags between infection and death.
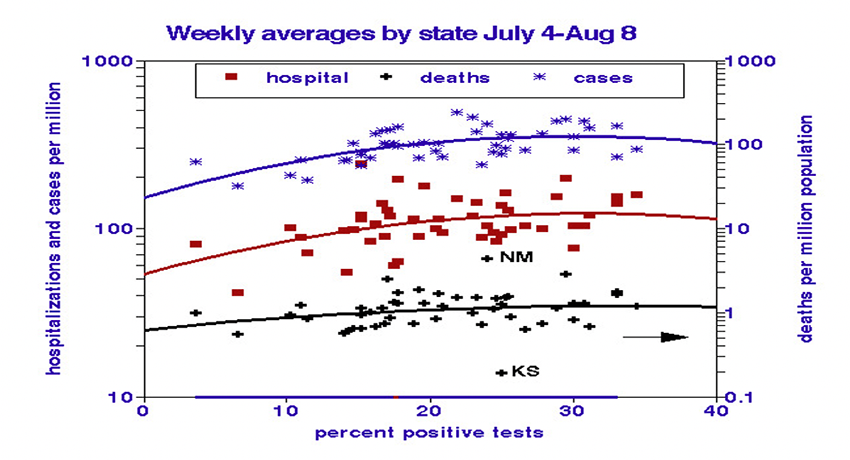
The weak relationships between COVID outcome metrics suggest that individually they may provide helpful information. We used graphs to display them and to test for nonlinearity. The percentage of positive tests predicts nonlinear increases in infection and hospitalization rates. States with more than 20% positive tests show no relationships, perhaps indicating over-zealous testing. There were no correlations between testing and mortality.
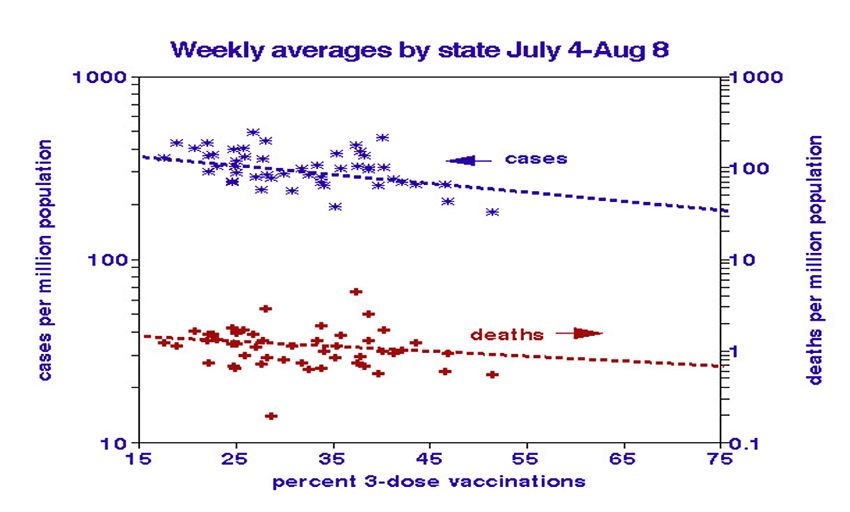
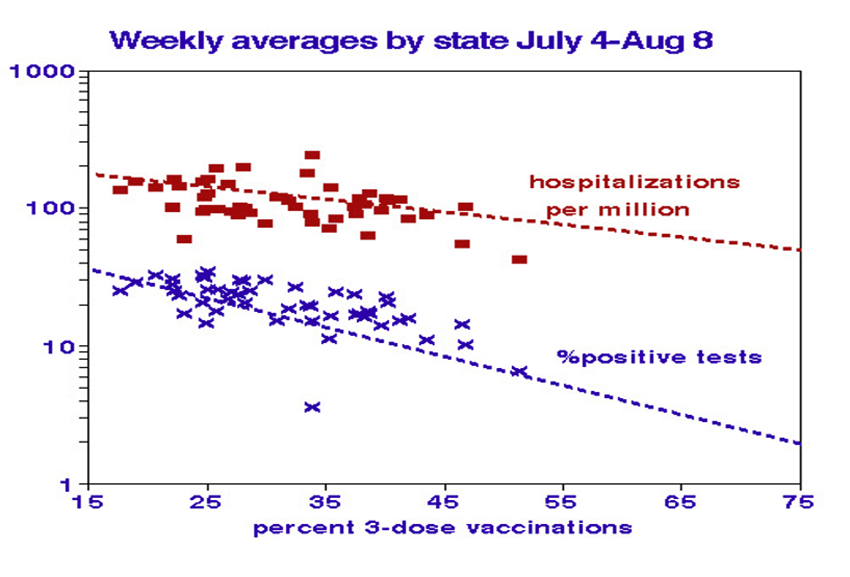
We used the percentages of 3-dose vaccinations (the original series and a booster) to illustrate vaccination benefits, which are somewhat more complex. Case and death rates decreased linearly as expected, but only moderately (approximately halved over the vaccination range). The strongest relationship with vaccinations is with test positivity (7-fold decrease), followed by hospitalization rates (3-fold reduction). The hospitalization relationship showed nonlinearity, dropping off faster at higher vaccination rates.
Lagging Effects
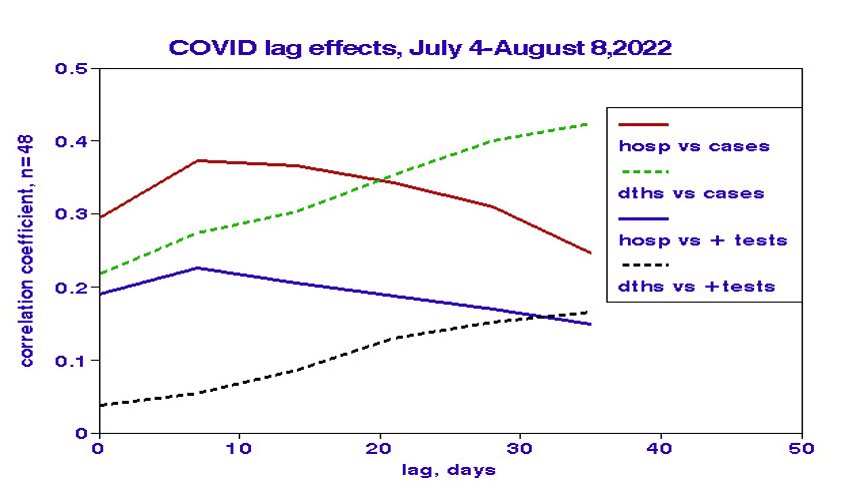 We computed bivariate correlations between hospitalizations and cases or positive tests for 2 to 5 weeks lags. Since an inappropriate lag reduces correlation, we interpreted the maximum correlation as an indicator of the correct lag. Correlations with hospitalization peaked at lags of about ten days. By contrast, mortality correlations increased steadily with lag, consistent with our previous temporal analysis. The lower correlations with positive tests may reflect noise resulting from variations in testing protocols among states.
Limitations
We considered spatial variations among states over only six weeks; extrapolation to the future is thus problematic and consideration of lags was limited. Spatial variability is affected by differences in demography and behavior, but such factors are unlikely to have changed substantially during this period. Separate statistical analyses of selected spatial characteristics showed significant relationships with vaccination coverage and test positivity, less so for hospitalizations and deaths.
“The American people deserve an urgent, robust, and professional response to the growing public health and economic crisis caused by the coronavirus (COVID-19) outbreak.”
In terms of effects on outcomes, vaccination was the most critical factor. Extrapolating the linear relationship shown above, 100% coverage of 3 doses would indicate a future national death rate of about 230 per day (82,000 annually) that would rank as the 7th most common cause of death and about double the typical annual rate for influenza. However, the current mortality rate is about twice that level and now ranks as approximately the 5th largest cause of death in the United States.
[1] COVID-19 Deaths Follow Infections, But When?
[2] Evaluating the Association of Face Covering Mandates on COVID-19 Severity by State. Journal of Primary Care and Community Health DOI: 10.1177/215019221087720
[3] Here we define exposure as those physical conditions facilitating contact with the agent in question, but not including the dose of that agent.


