
Lags in reported deaths have at least two sources: physiological and bureaucratic. A case, defined as a positive test result, will pursue a variable course, only some require hospitalization, and fewer, about 1%, succumb; this progression takes time. COVID deaths are defined from death certificates, but there may be bureaucratic delays in that certification.
“Lagging Death Counts Muddled Our View of the COVID-19 Pandemic”
Lags result from differences in trends. COVID-19 cases are controlled by the interplay of exposure, affected by virus transmission and personal protection. Mortality is affected by infection severity, individual resilience, and medical treatment. Fortunately, mortality rates remain a few percentage points of case rates.
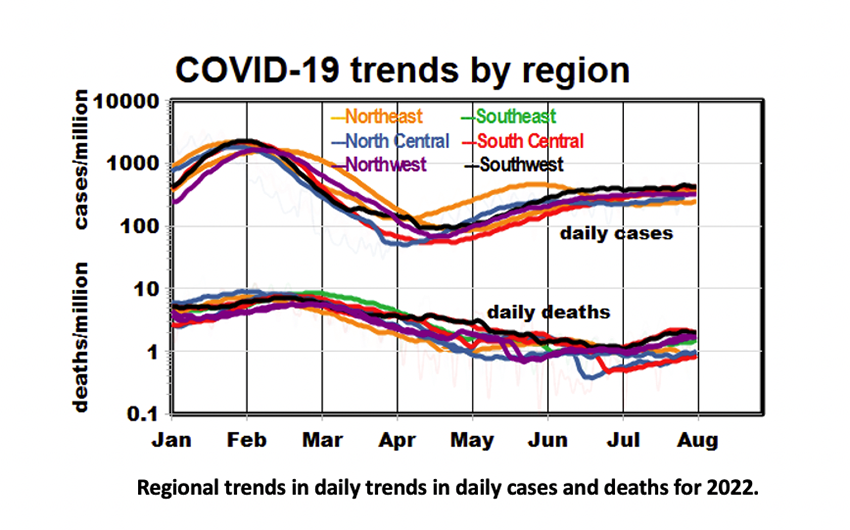
Here are some of the key trends during the pandemic:
- Spring 2020: The full-blown epidemic began in the Northeast, with deaths closely tracking cases.
- January 2021: The original 2-shot vaccine program got underway and significantly decreased infection and subsequent death rates.
- Summer 2021. The Delta virus variant struck and increased trends for both cases and deaths.
- Fall 2021: The first round of booster shots became available to those who received the original shots six months previously, but benefits were less apparent.
- November 2021: The Omicron virus variant arrived and spread rapidly in all regions, increasing cases more quickly than deaths.
- Spring 2022: The second round of boosters became available to those who had received the previous shots. Case and death rates decreased substantially.
- Summer 2022. The BA.5 subvariant of the Omicron virus variant became dominant in the U.S., increasing cases while death rates mainly continued to decrease.
Trends since last May are more difficult to interpret; death rates decreased while cases increased substantially. The most striking observation is the ~10-fold range in case-fatality rates during this pandemic.
Lag Time
The published literature on COVID lag effects is sparse and outdated, partly because of the typically slow editorial pace through journals. Studies based on individual clinical records have been limited to manageable numbers and were thus subject to statistical limitations. One of the most thorough population investigations included data only through July 2021. Our previous regional trend analyses showed death rates lagging behind case rates by up to several weeks.
Here we drew on the entire US database through August 3, 2022 - 90 million cases and 1 million deaths, using seven-day moving averages to reduce random noise. We used our previous COVID mortality model that assumes a given infection rate and seeks to explain the corresponding changes in death rates. However, the significant changes in the pandemic’s metrics over time, shown above, must also be considered; the problem is thus four-dimensional (case rate, death rate, elapsed time, and lag), for which we used graphical methods. Our analyses are based on logarithms of national cases and death rates.
We plotted death rates vs. cases per million population for specific lag intervals, from coincident (lag of 0) to 42 days. To distinguish the periods, we connected the data points by time sequence with color codes.[1] We included dashed lines to show the statistically smoothed quadratic curve-fit over the pandemic. The dates are the beginning of the subperiods. Here are some of our observations.
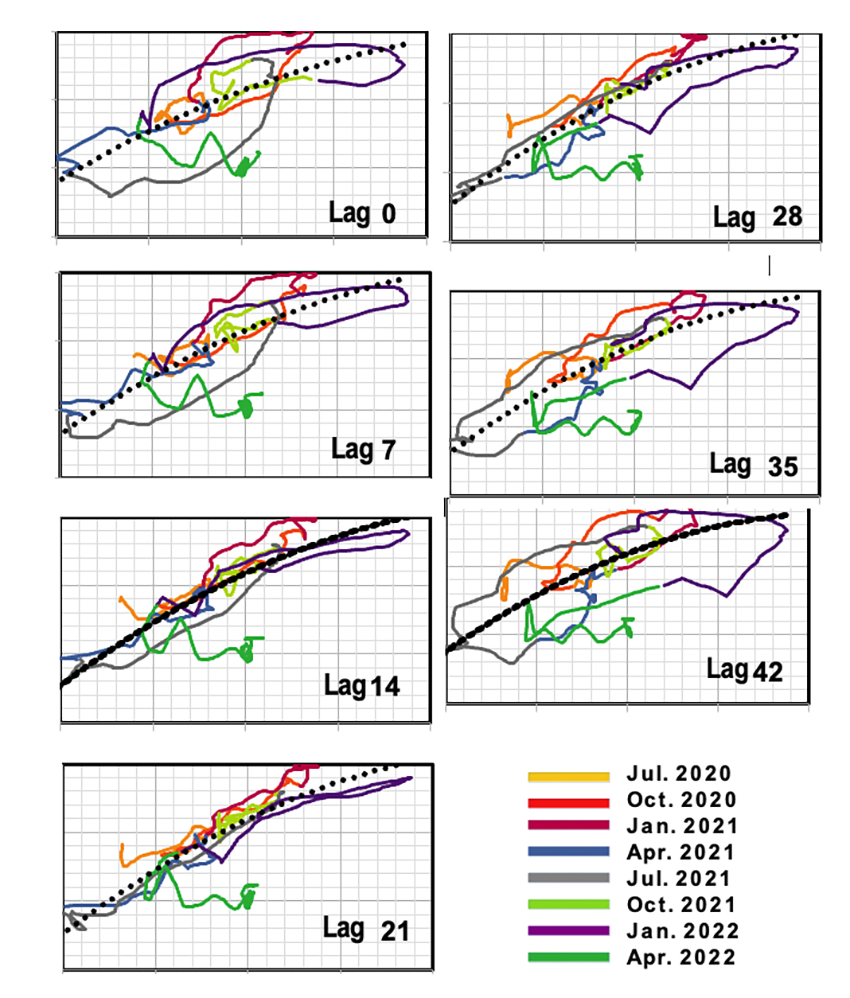
- No lag: essentially random distributions with death rates leveling off since April 2020.
- 7-day lag: improving fit about the trend line.
- 14 and 21-day lag: excellent coalescence about the overall trend line except for the most recent period.
- 28-42 day lag: increasing divergence from the trend line with continued leveling off this summer.
Generally, the relationship between death and infection rates is nonlinear, with the highest infection rates substantially less lethal. There were exceptions in early 2020 when infections appeared more lethal, and perhaps a lack of “standard medical management” was at play. Most recently, there is essentially no relationship between infection and death rates, and trends have begun to resemble the overall trend line with a longer lag.
Correlations
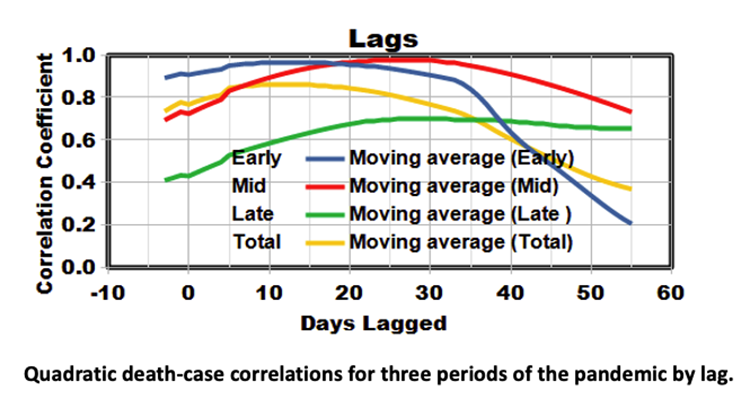
The smoothing procedure in the above plots also produced correlation coefficients describing how well the prescribed (quadratic) relationship between deaths and cases fit the data. We used this procedure to examine the temporal variations of lags in more detail during three successive periods using moving averages of single lag days up to 55 days. We found the correlation between cases and deaths robust for the first two periods and substantially lower during the most recent period. The optimum lag intervals expanded with each successive interval, 10-15 days, 25-30 days, and 30-50 days, respectively. The optimum lag for the entire pandemic was about 14 days. The weakened correlation between cases and death for the most recent period suggests that other factors may have been significant.
Lessons learned
The lag between infection and death may be considered an inverse measure of infection severity, the ability of the medical system to deal with it, or the patient's resilience. The relationship between cases and fatalities is ever-changing:
- The relationships are substantially nonlinear. Over the entire pandemic, the case-fatality ratio was 1.7% at 100 cases per day but only 0.5% at 2000 cases per day. This trend may reflect the improved treatment of infections, the inclusion of younger patients, or less selective testing.
- Relationships differed substantially between each of the periods.
- The case-death correlation was essentially unchanged from July 2020 to April 2022, notwithstanding concurrent vaccination programs and the arrival of new virus variants.
- Optimum lag periods, aligning cases with mortality, increased from nil to 40+ days over the pandemic.
Lacking other explanations, we will stay with our increasing lag hypothesis and wait for more data.
“If you don’t know where you’ve come from, you don’t know where you’re going.” – Maya Angelou
[1] The logarithmic scales for the multiple-lag graphs run from 0.32 to 10 for deaths and 32 to 3160 for cases.