
“This is no time to stop tracking COVID-19. To live with the coronavirus, we cannot be blind to its movements.” Editorial, Nature
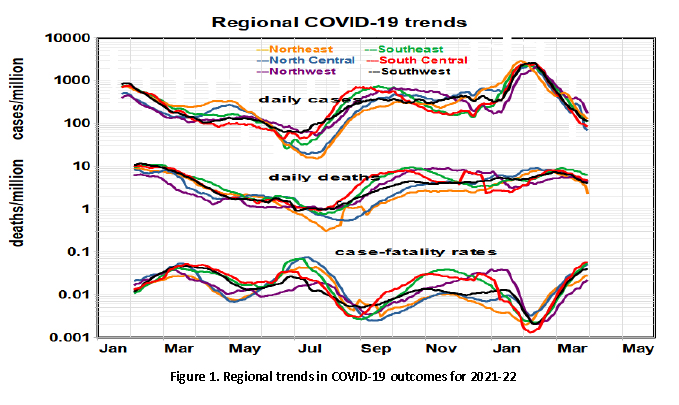
Death rates have been virtually flat since last summer. The recent peak infection case rate exceeded last winter’s, and the current minimum rate exceeded last summer’s. Despite previous regional differences in personal behavior and vaccination rates, regional gradients have essentially vanished - the Omicron variant has affected the entire nation. Case-fatality rates (CFRs) similarly display a see-saw pattern with cycles of about four months and roughly 10-fold swings.
 Our long-term trend analysis shows cases and deaths increasing, cases more so. However, the relationship between cases and hospitalization [1] changed in 2021 as case rates continued to climb, hospitalization fell.
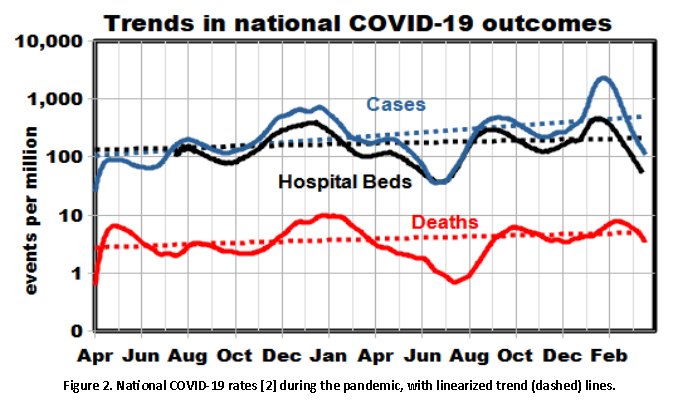
We began these COVID studies two years ago by studying spatial differences between states and regions that have changed markedly. We then studied temporal patterns, including seasonal and other cycles, that differ between cases and deaths and continue to change. Both modes treated the three outcomes as independent, as in Figures 1 and 2.
Now we take a new turn, comparing outcomes throughout the pandemic. We hypothesized that the distribution of cases is determined by several interacting factors and then analyzed the corresponding outcomes in cross-plots: cases leading to hospitalization (Figure 3) and deaths (Figure 4).

Case rates predicted “hospital beds in use” very well, at an average rate of about 60%. However, at higher case rates, the relative rate of hospital bed usage decreased substantially. When the daily case rates reached 1000, a smaller proportion of the population required hospitalization.
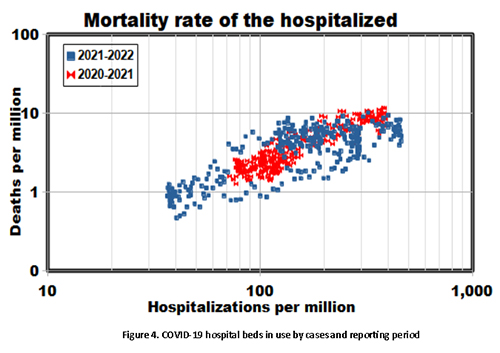 COVID-19 deaths tend to lag infections and hospitalization, which must be considered when comparing rates. We found a more consistent relationship with deaths occurring two weeks later (Figure 4). After adjusting for this lag, our analysis compares COVID-19 outcomes regardless of timing; temporal and spatial differences have become random variations.
Various exposure and immunity factors establish the infection timeline, and hospitalizations and deaths follow suit. Known temporal factors include vaccination rates and the emergence of new variants. Exposure factors include social distancing and face-mask mandates. We partitioned the dataset to investigate overall effects, comparing the first and second halves of the overall dataset (red and blue data points in Figures 3 and 4). We found no significant differences between the two subsets, notwithstanding the vaccinations that began in January 2021. While vaccinations likely contributed to the substantial drops in cases in early 2021, Figures 3 and 4 suggest that they brought little in the way of subsequent mortality benefits or that changes in the virus variants may have obscured them.
There have long been concerns about the reliability of COVID-19 statistics; the consistent trends among three different outcomes over two years support the overall validity of the public database.
Underlying all of this is the absence of indications that COVID-19 may soon disappear from the global scene. The need to make sense of the ever-growing database continues.
[1] The hospitalization rate is labeled “hospital beds in use” in the GitHub database.
[2] We used the average of the six regions to represent the entire nation for these analyses.


