What do we know about immunity?
The broad protection afforded by vaccination and by that acquired from a COVID-19 infection appears to reduce the incidence and severity of the disease. Here are some salient considerations.
- The duration of protection gained from COVID-19 vaccination or acquired through infection is unknown but estimated at about six months.
- Our immune system is less effective as we age.
- Breakthrough cases [1] and re-infections occur – immunization is not totally protective.
- Natural infections are more lethal than breakthrough infections.
- Differences between vaccination and acquired immunity are not entirely understood.
- These uncertainties suggest that our estimates of immunization benefits are likely overstated.
We used state-level data of cases from 2021 to illustrate the current levels of protection. The data points in the 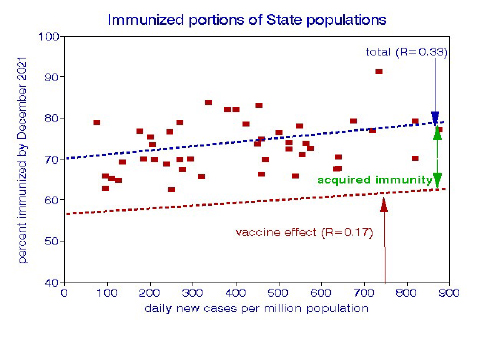 graph indicate the percentages of state populations that have been immunized. We represent acquired immunity as cumulative cases, adding 15% to those vaccinated. The graph is essentially a snapshot of the current situation. Vaccination is by far the most essential immunization strategy; about 60% of the population is now fully vaccinated.
How have vaccinations and previous infections depleted the population at risk?
Because the apparent incidence of both breakthrough and re-infections appears to be low, we define the population at greatest risk as individuals who have neither been vaccinated nor protected by prior infection, i.e., the susceptible. The total population at risk is about 26%, varying from 10% in Rhode Island to 40% in Idaho. We found a significant positive relationship between the daily infection rate and depletion of the susceptible state population.
What factors are associated with cumulative COVID-19 infections?
We used statewide data on COVID-19 cases and vaccinations from March 2020 through November 2021 from the 48 contiguous states, having left out Washington, DC, as an outlier. We used a measure of political preference from the 2020 presidential election as a marker of personal behavior during the pandemic, such as wearing or not wearing a mask, vaccination, social distancing. We believe that such personal behavior remains relatively constant, and our numbers are based on statewide averages. Percentages of vaccination and political preference are based on statewide counts of individuals rather than less precise measures like income or education that tend to be highly heterogeneous within a state.
 The bulk of the cases occurred before the vaccination program began, implying that some 20 million cases may have been prevented. Our previous analyses found significant relationships between COVID-19 cases and income, education, population density, household crowding, race, vaccination rates, and political preference as a metric of personal behavior. In a population study like this, it is likely that more than one variable is of interest, requiring statistical analysis to establish priorities. Here, only vaccination rates (58%) and political preference (51%) remained drivers of immunity and a measure of those remaining unaffected by COVID-19. We used regression analysis to estimate their effects on the average infected percentage of the population, the susceptible 15% [2].
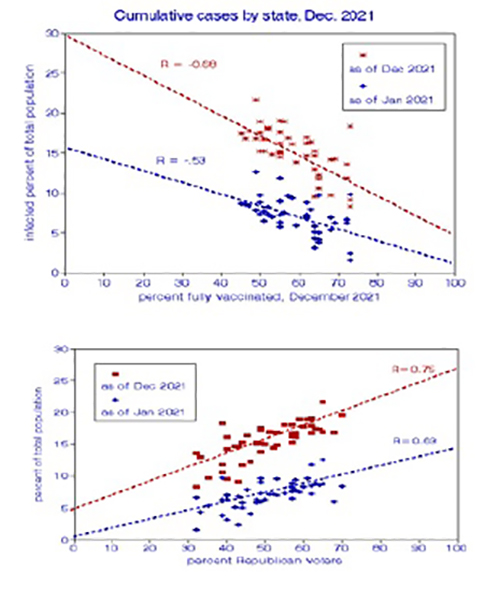
We compared the relative performance of vaccinations and political affiliation in predicting the cumulative infected fraction of the total population. They are highly correlated and essentially mirror images: vaccinations reduced infection rates while Republican “populations” were more likely to have higher infection rates. The graphs show that the slopes of these relationships became steeper in 2021. When considered in isolation, vaccination was a larger driver in the reduction of the susceptible than political affiliation. But when combined, as they are in the real-world, political affiliation had a greater impact than vaccination – our choices matter when it comes to reducing the susceptible. Our statistical analysis showed that these two factors accounted for essentially all of the state-wide variations in cumulative infections [2].
There are also considerations of timing. Vaccination rates ticked upward in November, but mainly in states that already were highly vaccinated. Immunity tends to decrease over time; our prior analysis reported a 3-fold decrease in vaccine effectiveness over about six months. By contrast, the behavioral patterns indicated by political preferences are likely to persist. Incongruities in our analysis shown in the graphs include significant benefits of vaccination before the program began and political relationships strengthening with time after the election.
We can only conclude that both factors are essential predictors of COVID-19 infection rates.
Some Concluding Thoughts
The remaining pool of the susceptible, at-risk population for significant morbidity and mortality from a COVID-19 infection would be significantly diminished (but not depleted) if current vaccination and infection rates continue. Both vaccination rates and political preference remain the best predictors of the population remaining at risk. The duration of immunity, whether from vaccination or acquired through infection, is a crucial factor that requires more detailed study.
According to conventional epidemiological wisdom, we won’t be safe until everyone is safe. A future scenario might involve reaching an asymptotic limit on full vaccination coverage. However, hard-core vaccination resisters might continue to infect one another and facilitate the expression of new variants that evade our immunity, vaccinated or acquired, resulting in the continued presence of the virus. Based on our current trends, the unaffected population most at risk for morbidity and mortality will be with us for about 18 months for the US as a whole and from 6 months to 5 years among states. Since immunity decreases over time, additional booster shots would likely continue to be needed.
[1] Infection of a fully vaccinated person is referred to as a “breakthrough” case. For example, New York State recently reported that 1.4% of the population aged 12 or more experienced such cases. Re-infections are the equivalent in unvaccinated individuals previously infected with COVID-19.
[2] We used a statistical procedure known as linear regression to estimate these relationships. A linear relationship may be written as y = a+ bx, where b is the slope and a is the intercept, the baseline value. The slope (b) represents the change in y per unit of x. When there is more than one x variable of interest, the equation may be written as y =a+ bx1 +cx2. The regression procedure finds the most likely values of a, b, and c for a given data set, and the correlation coefficient R describes the success of that procedure. The mean effect of x on y is given by b*mean x/mean y; the total effect on y would be given by a + b*mean x1/mean y + c*mean x2/mean y.


