
“Emergence of new variants of concern, vaccine hesitancy, and barriers to global vaccine equity have created challenges to containing the pandemic.”
Here we examine recent trends in COVID outcomes and vaccinations by using counts per million population and logarithmic scales to directly compare regions and trends. Vaccination data are presented as percentages of the regional population.
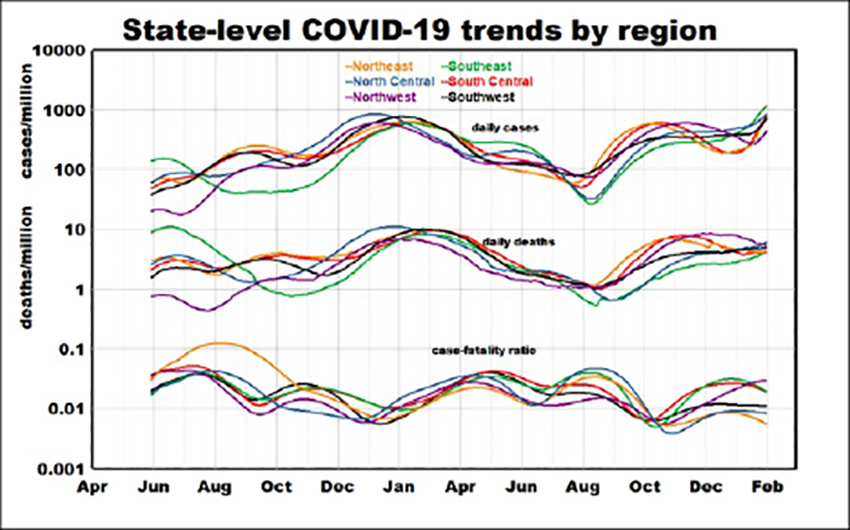
Across the entire pandemic we see cases rising about 10-fold, less so for deaths and for case-fatality rates (CFRs). The ranges of temporal variation are around 30-fold for all three metrics, with regional rankings varying over time. Deaths consistently lag cases with a range of about 25-fold. With the rise of Omicron in January, infections increased sharply while mortality rates remained relatively stable or decreased - consistent with less severe outcomes from the Omicron variant. Overall infection and mortality trends could be interpreted as lows in summer and highs in winter, but the 10-fold ranges greatly exceed seasonal trends typically reported for other diseases.
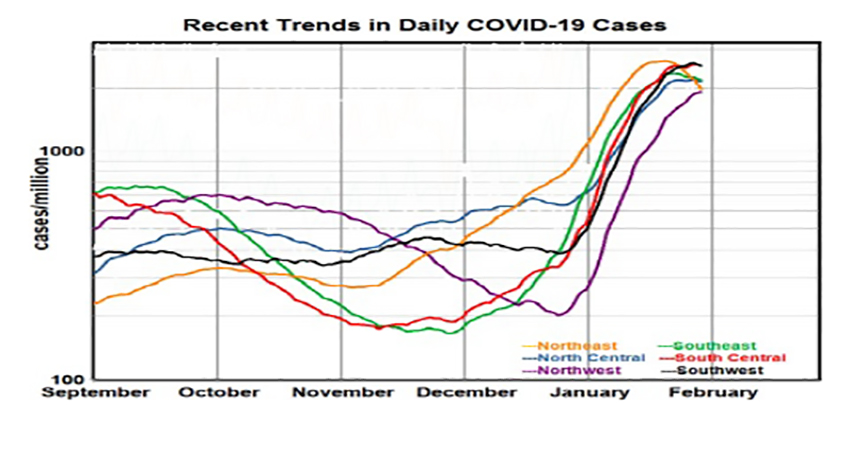
We considered regional cases separately for a more detailed examination of the past 6 months. They show periods of substantial diversity in the fall followed by coherence this winter. Contributing factors include initiation of the booster vaccination program in September and arrival of the Omicron variant in mid-December. There are substantial regional differences in rates of improvement in fall but not during the January surge.
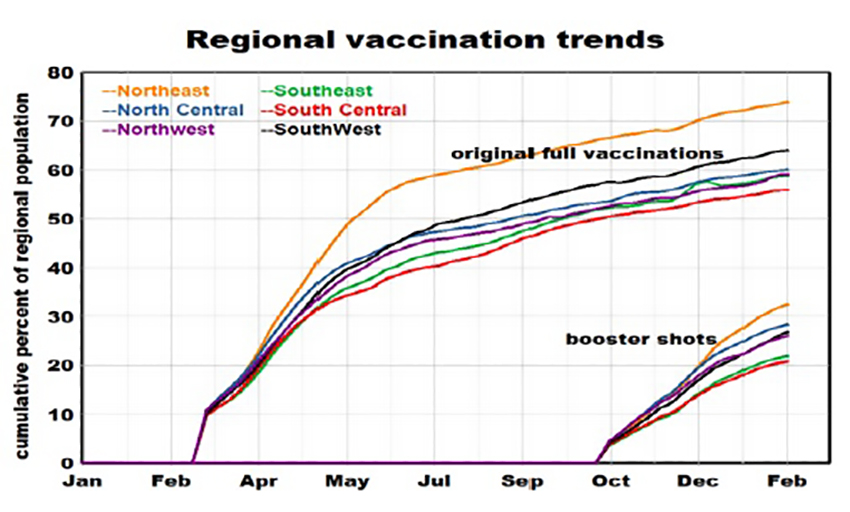
 The most important source of temporal variation in 2021 was initiation and deployment of vaccinations, beginning with the primary series of two shots in January and followed by booster shots in the fall. Regional variations in vaccination rates are modest, highest in the Northeast, lowest in the South. Primary vaccination rates leveled off after July, but booster inoculation rates were still increasing in February but reaching only about 25% of the population.
We found a weak non-significant relationship between cumulative vaccinations and weekly rates of new infections, by region. There was a 2.3% decrease in infection rate with an upper confidence of 5.9% associated with each percentage point in cumulative vaccination. During the fall booster vaccination period, all infections showed varying decreases. We found no significant differences among regions during the initial vaccination period, but cases increased sharply in all regions during booster shot deployment.
 The data reported “are what they are”, but are they what they purport to be?
Both case and death counts are notably subject to more-or-less random errors including:
- Delays in reporting.
- Failure to account for results from home testing.
- False positives or negatives.
- Deaths from pre-existing conditions attributed to COVID-19.
Our basic protocol has been to analyze temporal and spatial gradients separately. We assume that factors like age, race, education, and income vary geographically but remain constant over time; while ambient air quality, social interactions, and distrust of government [2] likely vary in both space and time. Reporting errors may be a function of hospital overload and statistically, additional random error in a causal variable weakens the relationship and reduces correlation. Correlations among potentially causal variables may bias a true relationship in favor of the factor with the most reliable data.
Superimposed on all of this are differences between individual findings from laboratory or clinical studies and population-based studies like ours and others. [2] While case and body counts are valid at all scales of analysis, factors like density or income are not. For example, New York City includes extremes of density and income that are not captured by New York State averages. Population studies are required to capture long-term trends.
We conclude that our population-based studies are likely to have underestimated potentially causal relationships; however, factors that nevertheless achieve statistical significance warrant closer attention.
“One reason this pandemic is an epidemiological mystery is because you see a surprising amount of variation among nations in close geographic proximity.”
Thomas Bollyky, director of the global health program, Council on Foreign Relations
We have long recognized the importance of geography in epidemiology; our current findings suggest re-examination of differences among states.
[1] COVID-19: October Surprises?
[2] Pandemic preparedness and COVID-19: an exploratory analysis of infection and fatality rates, and contextual factors associated with preparedness in 177 countries, from Jan 1, 2020, to Sept 30, 2021 Lancet DOI: 10.1016/S0140-6736(22)00172-6


