Spring brings new growth and new hopes. COVID infections continue, as do vaccine-driven hopes for relief. The White House announced that COVID-19 national and public health emergencies (PHE) will expire on May 11, but a Lancet editorial pronounced that the pandemic is “far from over.” We have been tracking its progress for three years - It’s time to take stock and go out on the shaky limb of prediction.

We first queried ChatGPT as a “straw person” to get an idea of the (ostensibly) conventional wisdom:
“As an AI language model, I cannot predict the future with certainty, and the end of the COVID-19 pandemic depends on a variety of factors, including global vaccination efforts, the emergence of new variants, and public health policies and practices.”
However, the past may be a prologue if we look hard enough. Here we used linearized regression slopes to characterize overall trends during the pandemic, which we then extrapolated to the future. We compared with previous influenza data to provide context for a tolerable future of COVID-19. Adverse outcomes have indeed diminished, but have they dropped far enough for public acceptance?
As with any observational study, what you learn depends on how you view it. We analyzed logarithms of COVID-19 outcome counts because of the exponential nature of the pandemic: the rate of new infection depends on the amount of virus already present. The death rate depends on the infection rate after accounting for lag. Infection rates thus drive the progress of the pandemic and rely on the balance between exposure (external factors) and resistance (immunity from prior infection or vaccination).
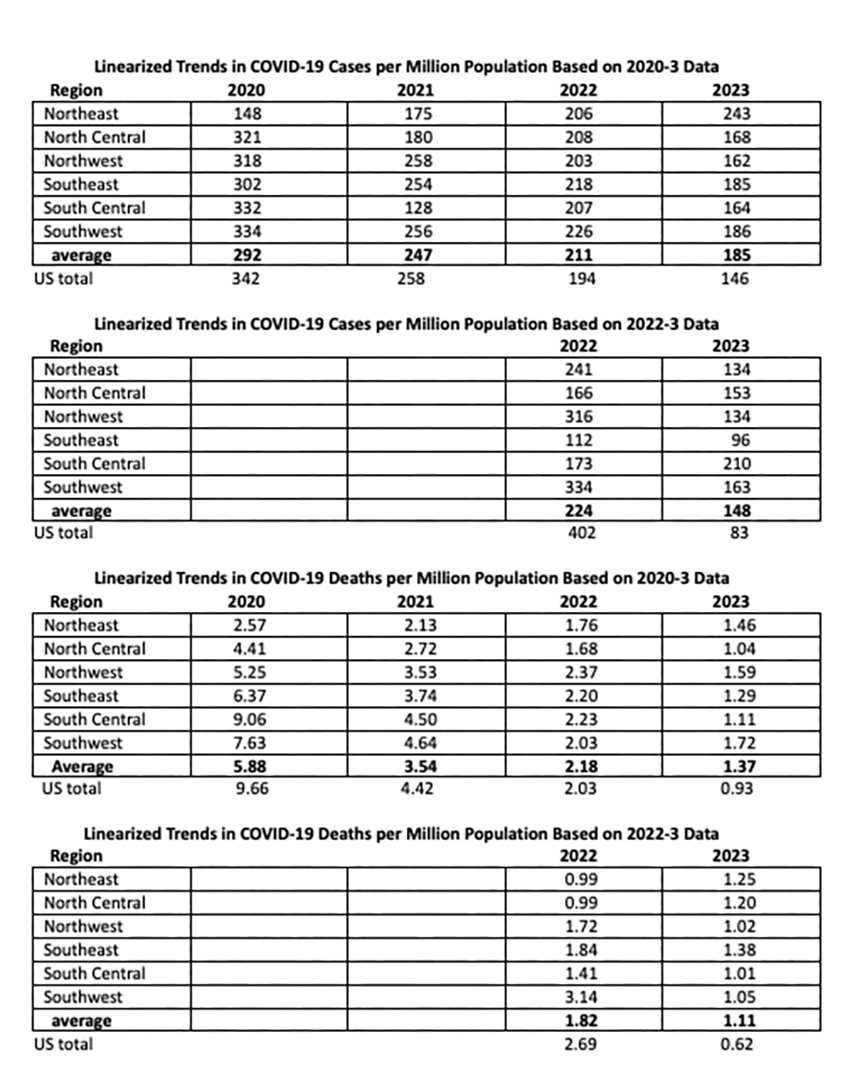
External factors like race or population density remained constant during the pandemic, while mask usage and vaccination rates declined, and new variants became dominant. The most important source of temporal variation is the virus’s contagiousness and the lethality of variants. Data for cases tend to be less reliable than for deaths because of reporting anomalies and home testing. We reported data by region to assess geographic changes during the pandemic.
Chronology of the Pandemic
- January 2020. COVID-19 virus arrived, with the most severe effects in the Northeast.
- Early 2021. Alpha variant arrived.
- January 2021. The original 2-shot vaccination program began.
- April 2021. First booster shots became available.
- June 2021. Delta variant arrived.
- August 2021 Second booster shots became available.
- November 2021. The Omicron variant arrived.
- August 2022 Bivalent booster shots became available.
Our analyses of regional COVID-19 statistics began in May 2020. In March 2021, we reported 10-fold increases in outcomes, up to about 1,000 cases per million population, with four-fold differences among regions. We posed a series of critical questions and a plea to better understand trends and regional differences. The following year, we reported that vaccination rates were stalled, masks were coming off, daily case rates reached 1,000, and deaths hit 10 per million in all six regions. Only about 60% of urban county populations had received the original and booster vaccinations (3 shots), significantly reducing cumulative cases and deaths. Large oscillations in daily infection and death rates continued into 2022.
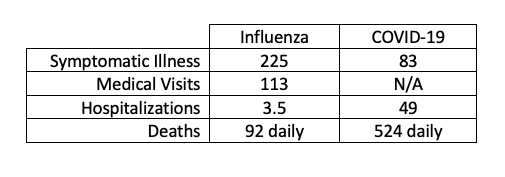
We used linear regression to assess long-term trends during the pandemic and extended the linear trend lines to the announced PHE end date. Because of the substantial peaks and valleys during the pandemic, temporal correlations are relatively weak but still statistically significant because of the large number of observations. Death rates declined more rapidly, halving annually and dropping about 10-fold overall. Despite the substantial peaks, these downward trends are encouraging for long-term public health. Because data for cases suggest that a stronger downward trend began in the spring of 2022, we replicated the trend analyses limited to the past 14 months (“recent trends”).
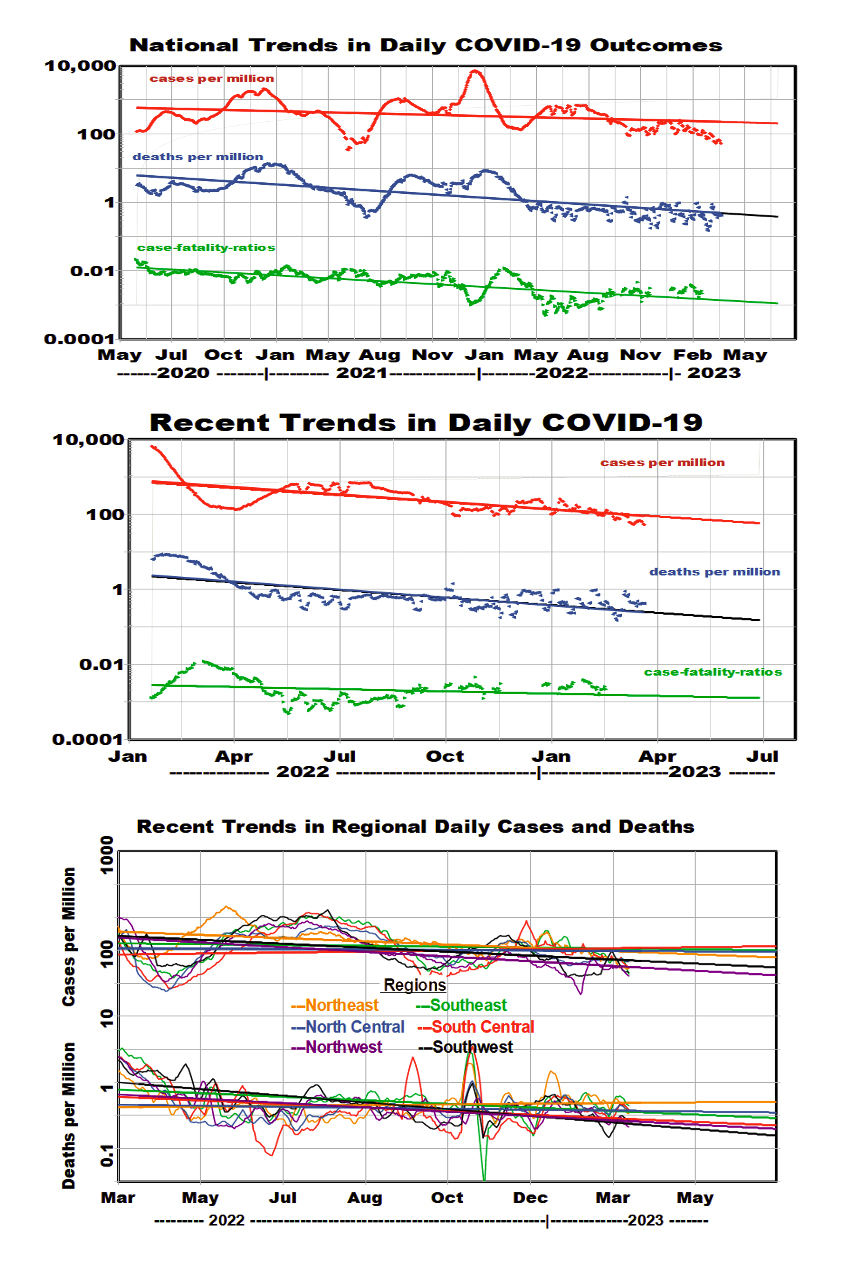 We used the linear regression equations to display mean rates of improvement nationally and regionally during the complete pandemic and for the past 14 months. The logarithmic analysis postulates constant rates of change: reductions of about 15% per year for regional cases and about 55% per year for regional deaths. These rates of improvement for patients were higher during the past 14 months, 50% per year. The spread among regions decreased substantially during the pandemic. The national rates of improvement were somewhat better.
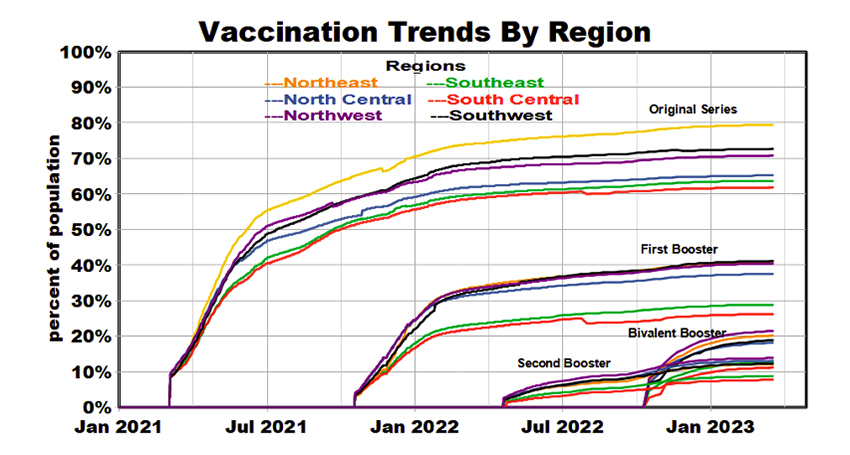
Comparisons with Influenza
 The public health question of future acceptable levels of COVID-19 persists and remains difficult to answer; comparisons with influenza provide some context. We looked at four public health flu metrics averaged over ten influenza seasons, converted them to equivalent daily averages per million population, and compared them with our COVID-19 estimates for 2023.
We estimate about half as many COVID cases as flu but about twice as many deaths. There was no trend in either flu deaths or hospitalizations during this 10-y period, but the ratios of flu deaths to illnesses decreased significantly, and the ratios of medical visits increased significantly. According to our linearized trend analysis and assuming continuity, COVID-19 deaths would not drop to influenza mortality levels until next year. However, there have been substantial COVID mortality variations among states, 12 of which reported COVID deaths at or below the average flu mortality level of 0.28 per million during April 6-12, 2023.
 Vaccination Trends
Vaccination remains the primary defense against COVID infection. Four separate vaccination programs have been conducted since January 2021, some of which were restricted to recipients of previous doses or the elderly. The recent “bivalent booster” is designed to respond to multiple virus variants. Coverage by region has been mixed, but each has reached an approximate plateau. Since vaccine efficacy typically decreases within about six months after injection, current vaccine effectiveness is unlikely to exceed 30-40%. The Northeast region generally has been the leader in vaccine coverage, and the Southeast and South Central regions have been the laggards. We see no apparent geographic relationships between vaccination coverage and linearized COVID outcome rates, but this does not preclude such relationships for fluctuations around the mean values.
Summary
We have shown consistently negative long-term trends in COVID infections, and the long-term trend in deaths is even more so, especially recently. However, this simplified statistical analysis says nothing about the major peaks of previous years that imposed severe outcomes, the recurrence of which cannot be ruled out. Explanations for these trends may include:
- Reduced exposures due to social distancing and masking
- Less aggressive and lethal variants
- Harvesting of the most vulnerable individuals
- Increased natural immunity from previous infection (at least 31% of the population)
- Early benefits of vaccination
“While WHO continues to urge that the pandemic is not over, (Director-General) Tedros has said that the end is in sight.”
Maybe. It depends on how you look but also where you look.