What the Study Did
The study sought to understand “the potential health implications of living near nuclear power plants,” by analyzing county-level cancer death records from the CDC paired with locations of nuclear plants. They generated a “proximity” measure accounting for distance between plants, where closer plants contribute more, and multiple nearby plants are additive.
This study analyzed nationwide U.S. data (2000–2018) to explore whether living closer to nuclear power plants is associated with cancer mortality. Using statistical models, the researchers compared cancer death rates across counties while controlling for other health factors—such as income, smoking rates, population density, and healthcare access—to isolate the relationship between proximity and cancer mortality.
Counties closer to nuclear power plants tended to have higher cancer mortality rates, particularly among older adults. The strongest associations were observed among women aged 55–64 and men aged 65–74, and risk generally decreased with increasing distance from plants. To be fair, the researchers found a geographical correlation. Or did they?
Proximity is not Dose
No direct measurements of radiation from these plants were taken. Instead, geographic proximity was used as a proxy—a reasonable starting point, since contamination typically decreases with distance. However, including locations up to 200 kilometers away—far beyond the range where measurable exposure is expected—weakens the connection between proximity and actual radiation dose.
Nuclear waste escaping from containment can be water-, air-, or soil-borne. The most significant routine environmental release is tritium, a radioactive form of hydrogen, mainly discharged in water used for cooling. Airborne release makes up a small portion overall, and soil-borne contamination, mostly due to airborne releases, has the lowest direct environmental impact. Environmental contamination and radiation exposure are mostly localized. Because these exposures are usually limited to short distances, using broad geographic proximity can misjudge who is actually exposed. This kind of mismatch adds “noise” to the data and can either obscure real effects or create misleading patterns.
All Cancers Are Not the Same
The study examined deaths from all cancer types, “even though different malignancies have varying latency periods and radiation sensitivities.” The sensitivity analysis in the study, which accounts for different latency intervals, however, very few cancers are linked to radiation 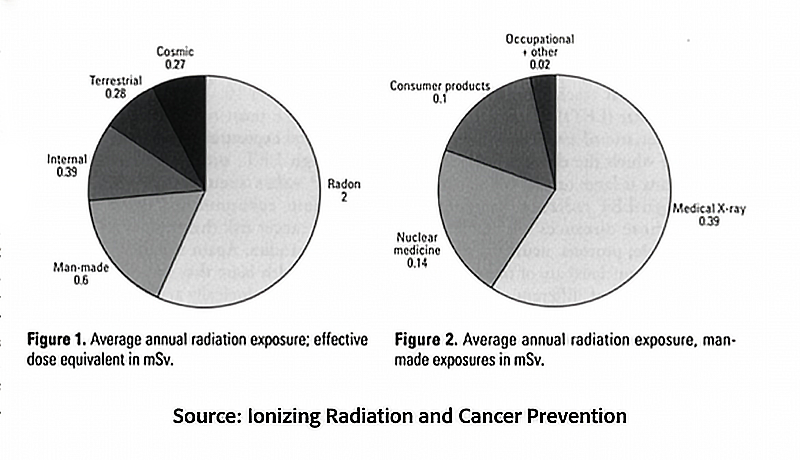 exposure. How few? The estimate is 1-3%. This graphic illustrates this point. The graph on the left shows that about 20% of cancers are related to man-made exposures; the chart on the right breaks down these exposures, with occupational and other sources accounting for only a small portion.
Grouping all cancers together masks possible stronger associations with specific cancers and produces a number that is more click-worthy than useful.
The Limits of County-Level Data
Because the cancer mortality data was county-based, the covariates that might influence radiation exposure, i.e., smoking history, occupational exposures, and individual health differences, and the overall progression of cancer were limited to population-level statistics and had varying effect sizes. Children are the most radiosensitive among us, but their incidence of cancer, which is often highly treatable, is poorly reflected in cancer mortality data. The researchers note that childhood deaths were “sparse,” resulting in “unstable estimates,” and were therefore excluded. Smoking was defined as current smokers, which would undercount exposures.
The researchers aimed to add more context to their findings by reporting the attributable fraction of nuclear plant exposures, which is the proportion of deaths in this population that can be statistically linked to a particular exposure, assuming the relationship is causal. While recognizing this significant assumption, they noted that the attributable fraction was generally small, typically falling between about 0.4% and 2.1% of cancer deaths across different groups.
A Misleading Comparison to Coal
They further compared apples and oranges with previous estimates of mortality from coal-fired power generation. Coal-related air pollution, measured by PM2.5, has been linked to significantly larger overall health impacts—about 20,909 annual deaths compared to 4,266 annual deaths among people aged 65 and older associated with proximity to nuclear power plants. The comparison is further complicated by the current study, which considers cancer-specific deaths, while the coal data addresses all-cause mortality. Given that an estimated 20% of all-cause mortality is due to cancer, nuclear power plants appear to be no more or less cancer-causing than coal-fired sources.
Signal or Statistical Mirage?
The authors are right about one thing:
“Understanding the potential long-term health implications of nuclear power generation is particularly important given the renewed interest in nuclear energy as a low-carbon solution.”
By relying on proximity instead of measured exposure, aggregating all cancers, and using coarse population-level data, the analysis introduces uncertainties that complicate establishing associations, let alone causal interpretations. The small attributable fractions further suggest that even if an association exists, its overall impact may be limited. At the same time, the study provides a useful starting point for more targeted investigations.
Ultimately, the study emphasizes a geographic link—not a proven cause of harm. That difference is important. Without direct exposure data and more accurate epidemiologic methods, conclusions about nuclear power and cancer risk remain uncertain. For a question this significant, “not so fast” is exactly the right response.
Source: National analysis of cancer mortality and proximity to nuclear power plants in the United States Nature Communications DOI: 10.1038/s41467-026-69285-4

Chuck Dinerstein, MD, MBA
Director of Medicine
Dr. Charles Dinerstein, M.D., MBA, FACS is Director of Medicine at the American Council on Science and Health. He has over 25 years of experience as a vascular surgeon.